Installation
Intruction
Install on Linux
Install on Kubernetes
Related Tools
Cluster Operation
Quick Start
Cluster Admin Guide
Multi-tenant Management
Platform Management
Infrastructure
Monitoring Center
User Guide
Storage
Configuration Center
Project Settings
Development Guide
API Documentation
Physical Resources
The KubeSphere Monitoring Center provides monitoring of CPU, memory, network, and disk metrics at the physical resource level, and supports historical monitoring and node usage rankings. The physical resource status is available on via Platform → Monitoring Center.
Prerequisites
You need an account of cluster-admin role and sign in KubeSphere, see the Admin Quick Start if not yet.
View the Cluster Status
Choose Physical Resources under Monitoring Center, you will be able to view the cluster resource monitoring status, including cluster node status, component service and cluster resource usage.
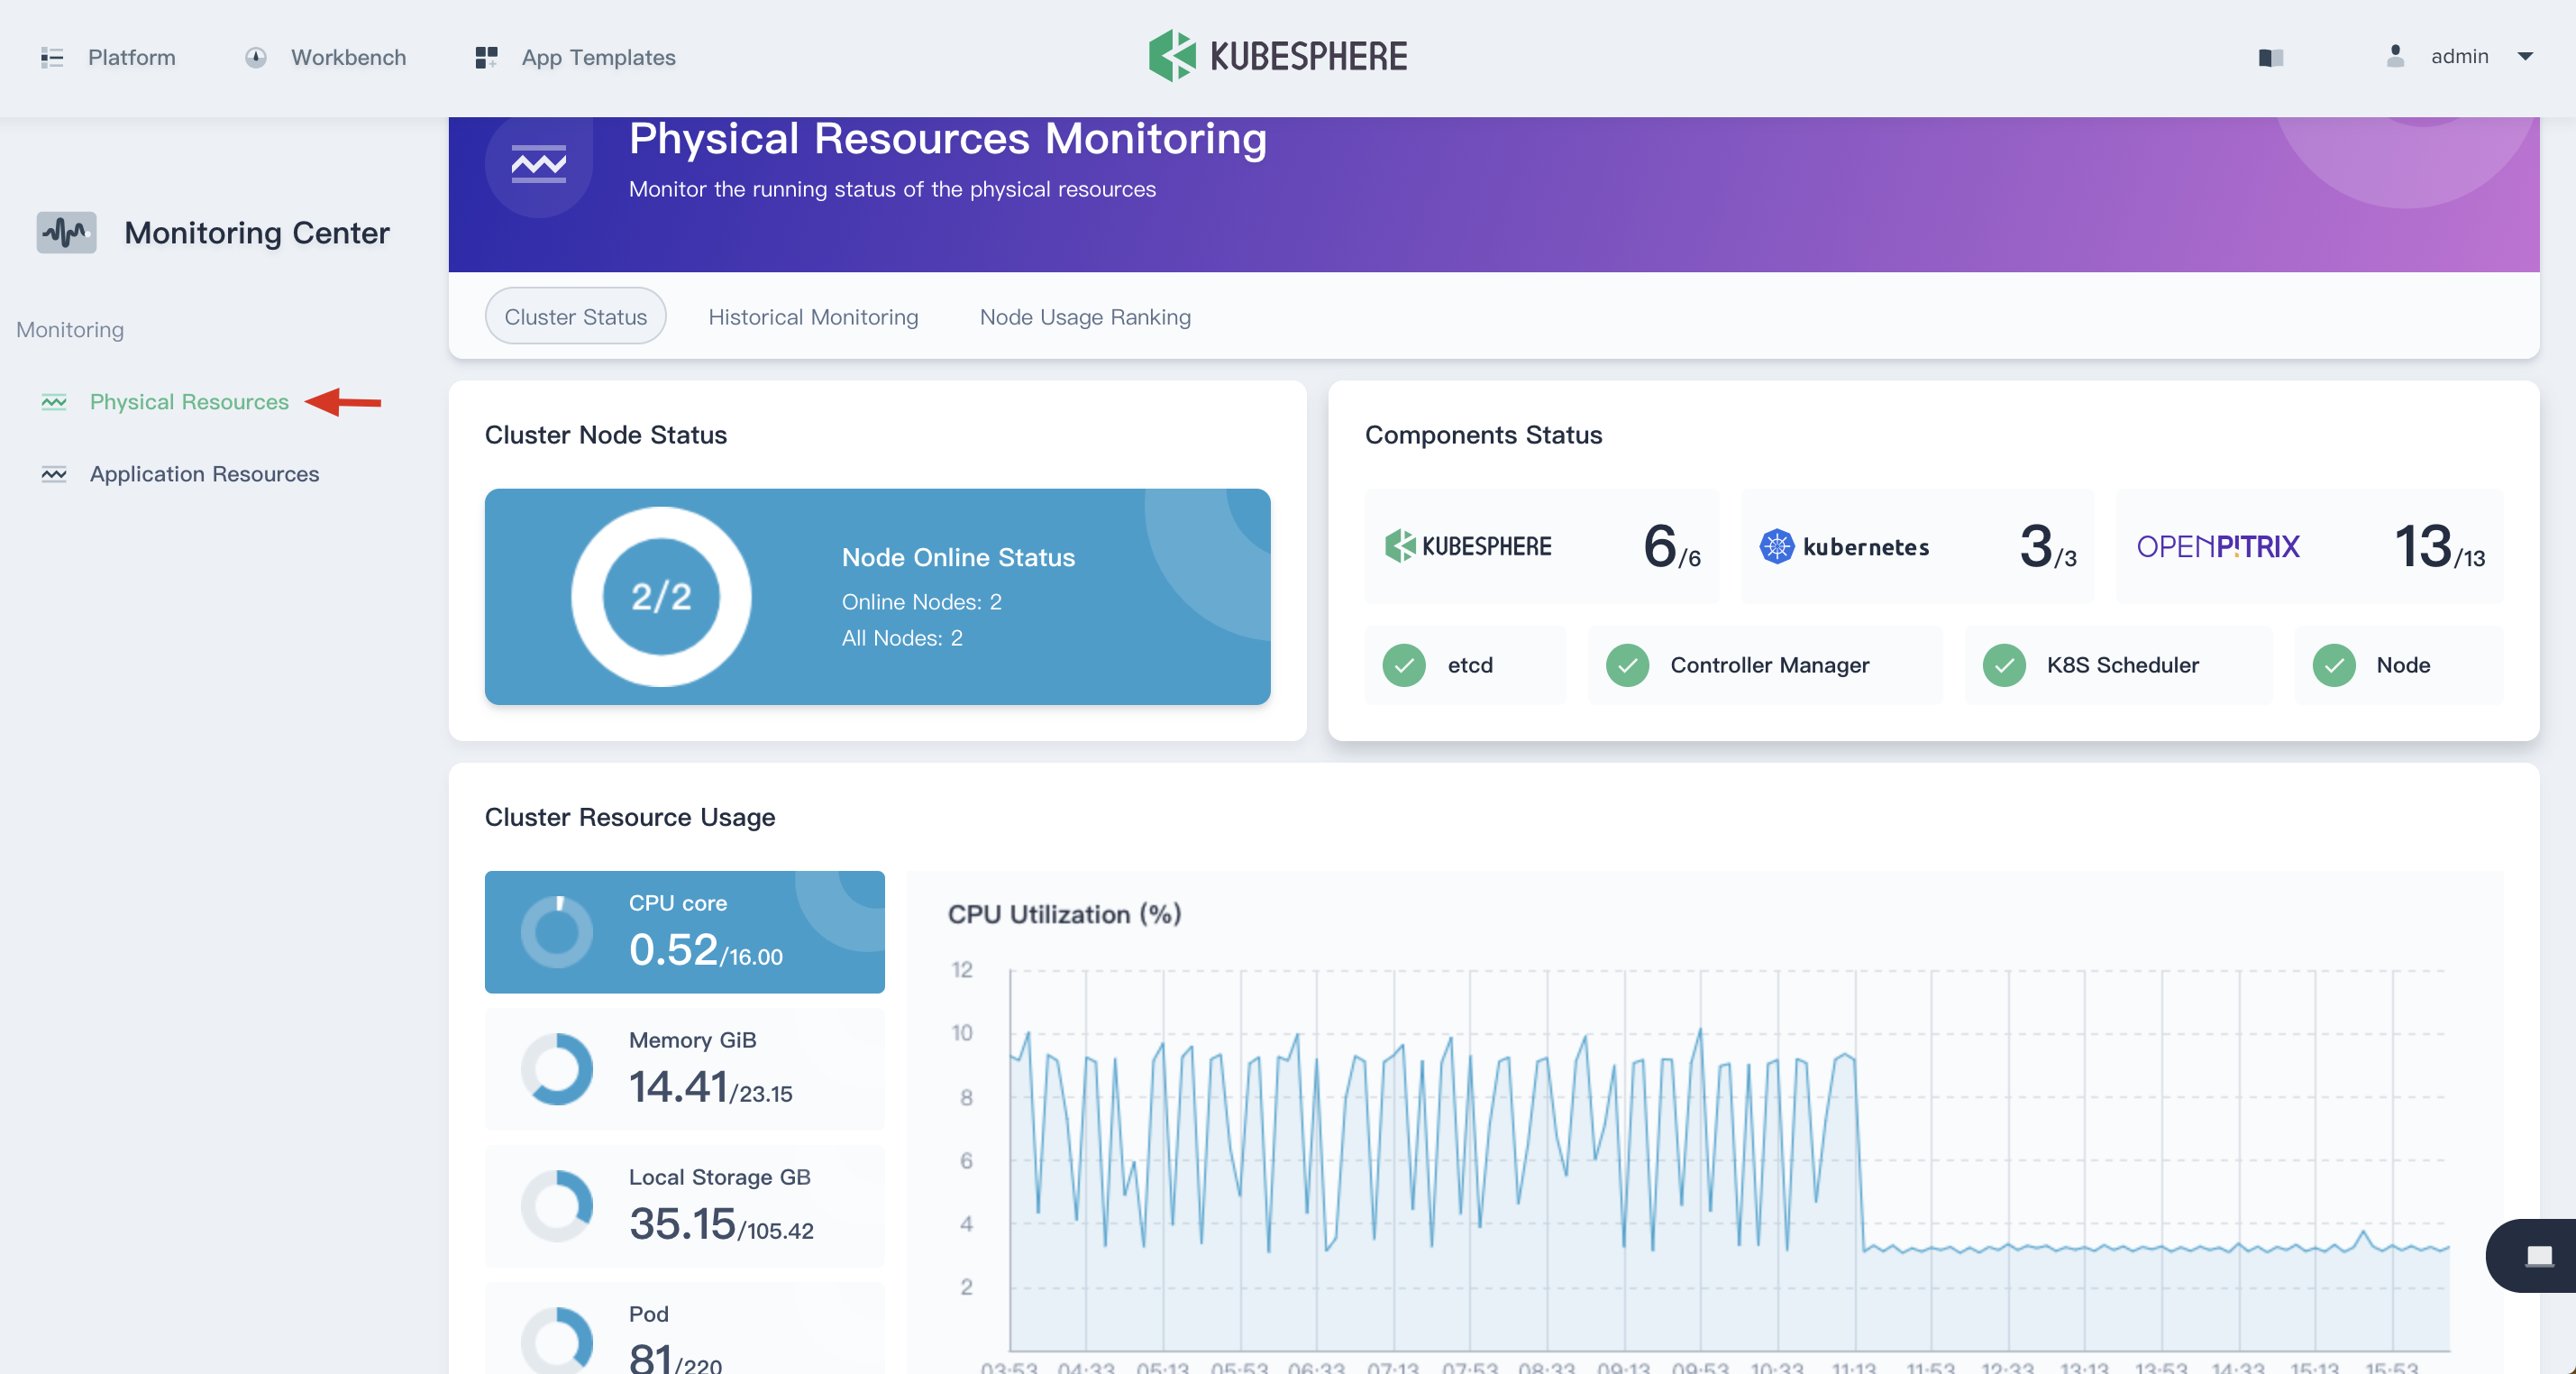
Cluster Node Status
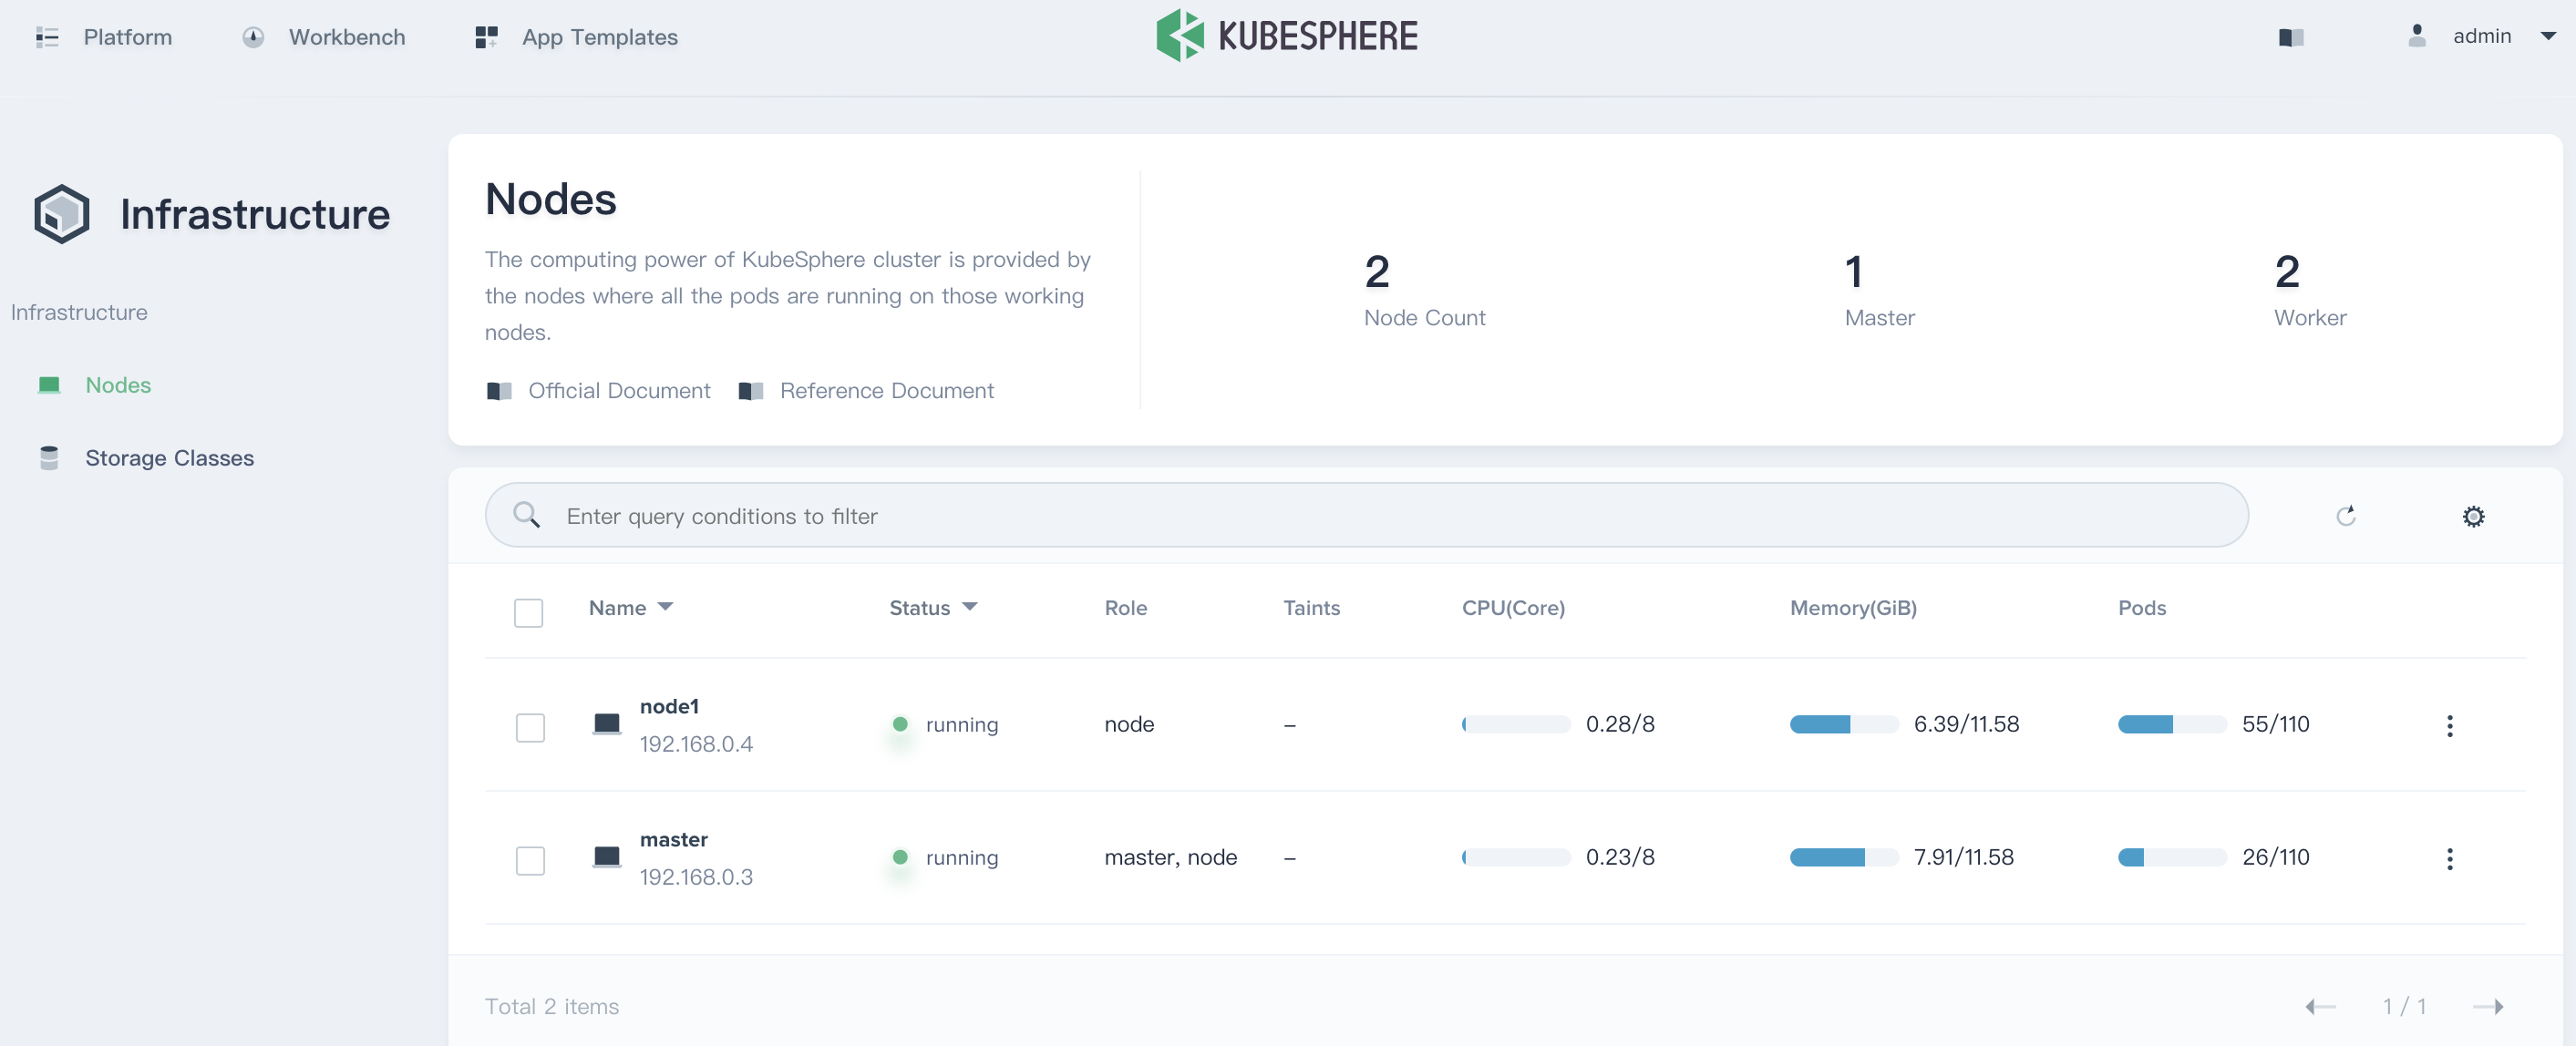
The cluster node status displays the current resource status of all nodes. It Supports drill down into node management page to view the real-time resource usage of all nodes. Click the node item to enter into the node management list.
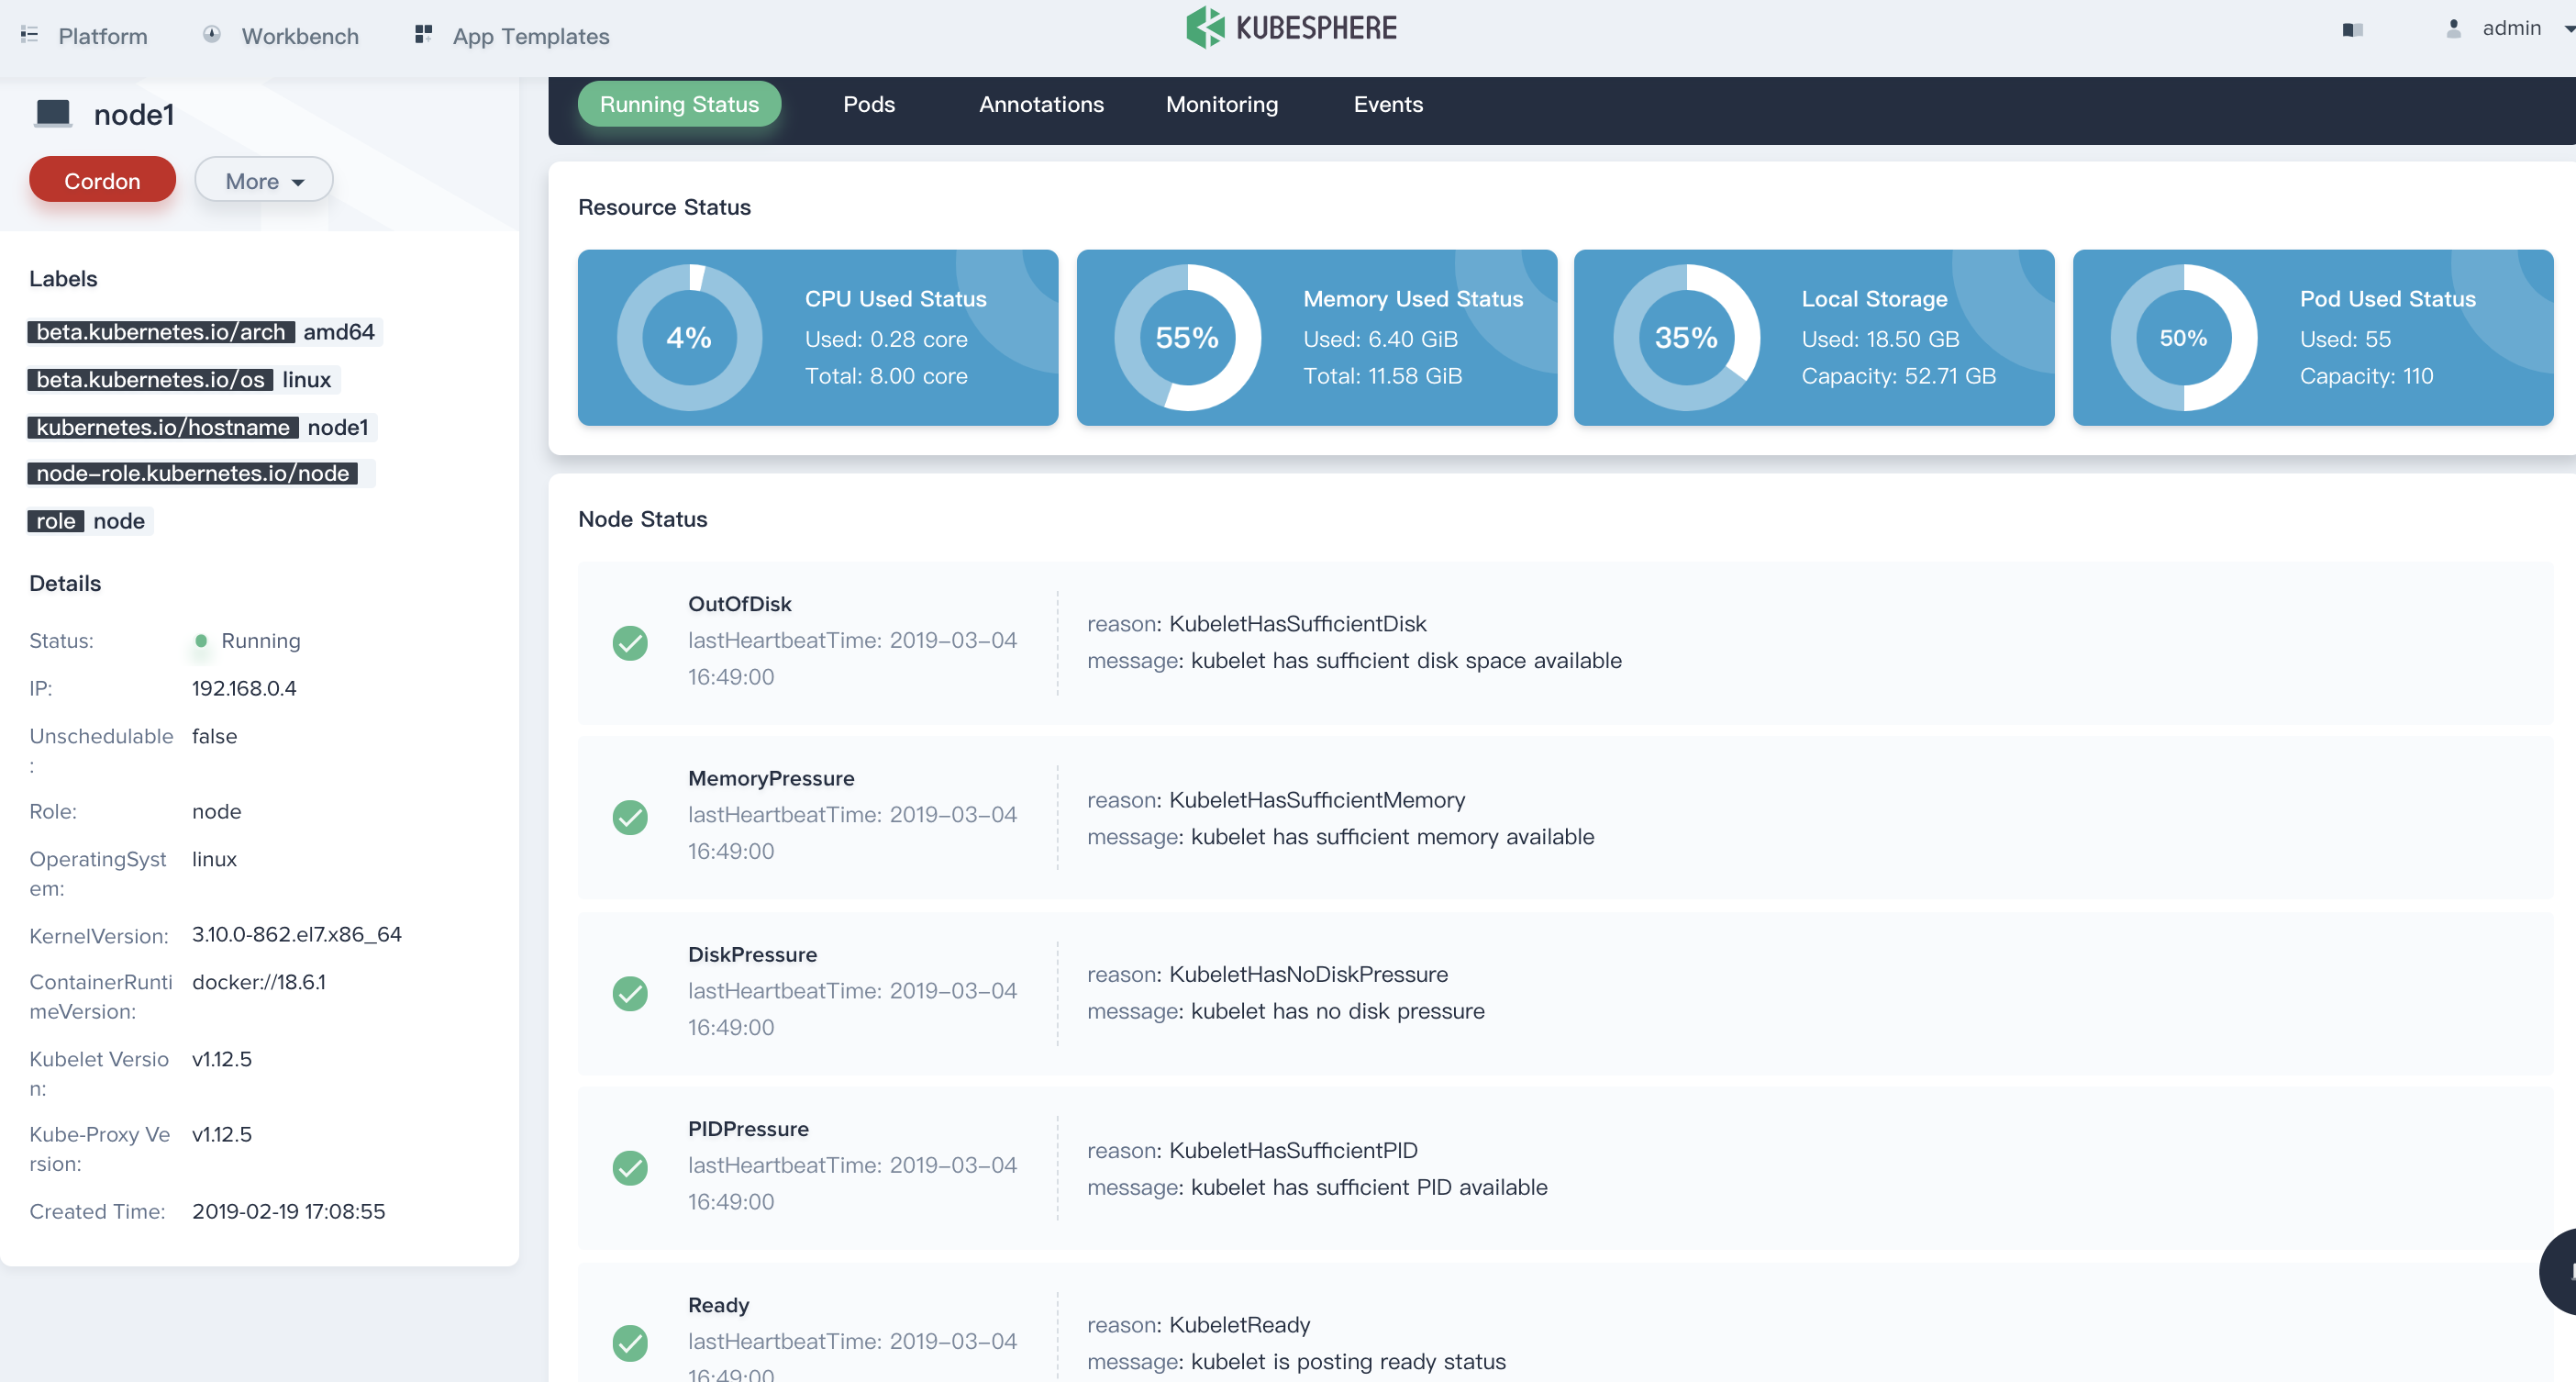
For example, the 192.168.0.4 node in the following list, click into it to view the details page of the host.
From the node details page, the current nodes' CPU, memory, local storage, and Pod usage can be seen in a straightforward way from the pie chart of the monitoring result.
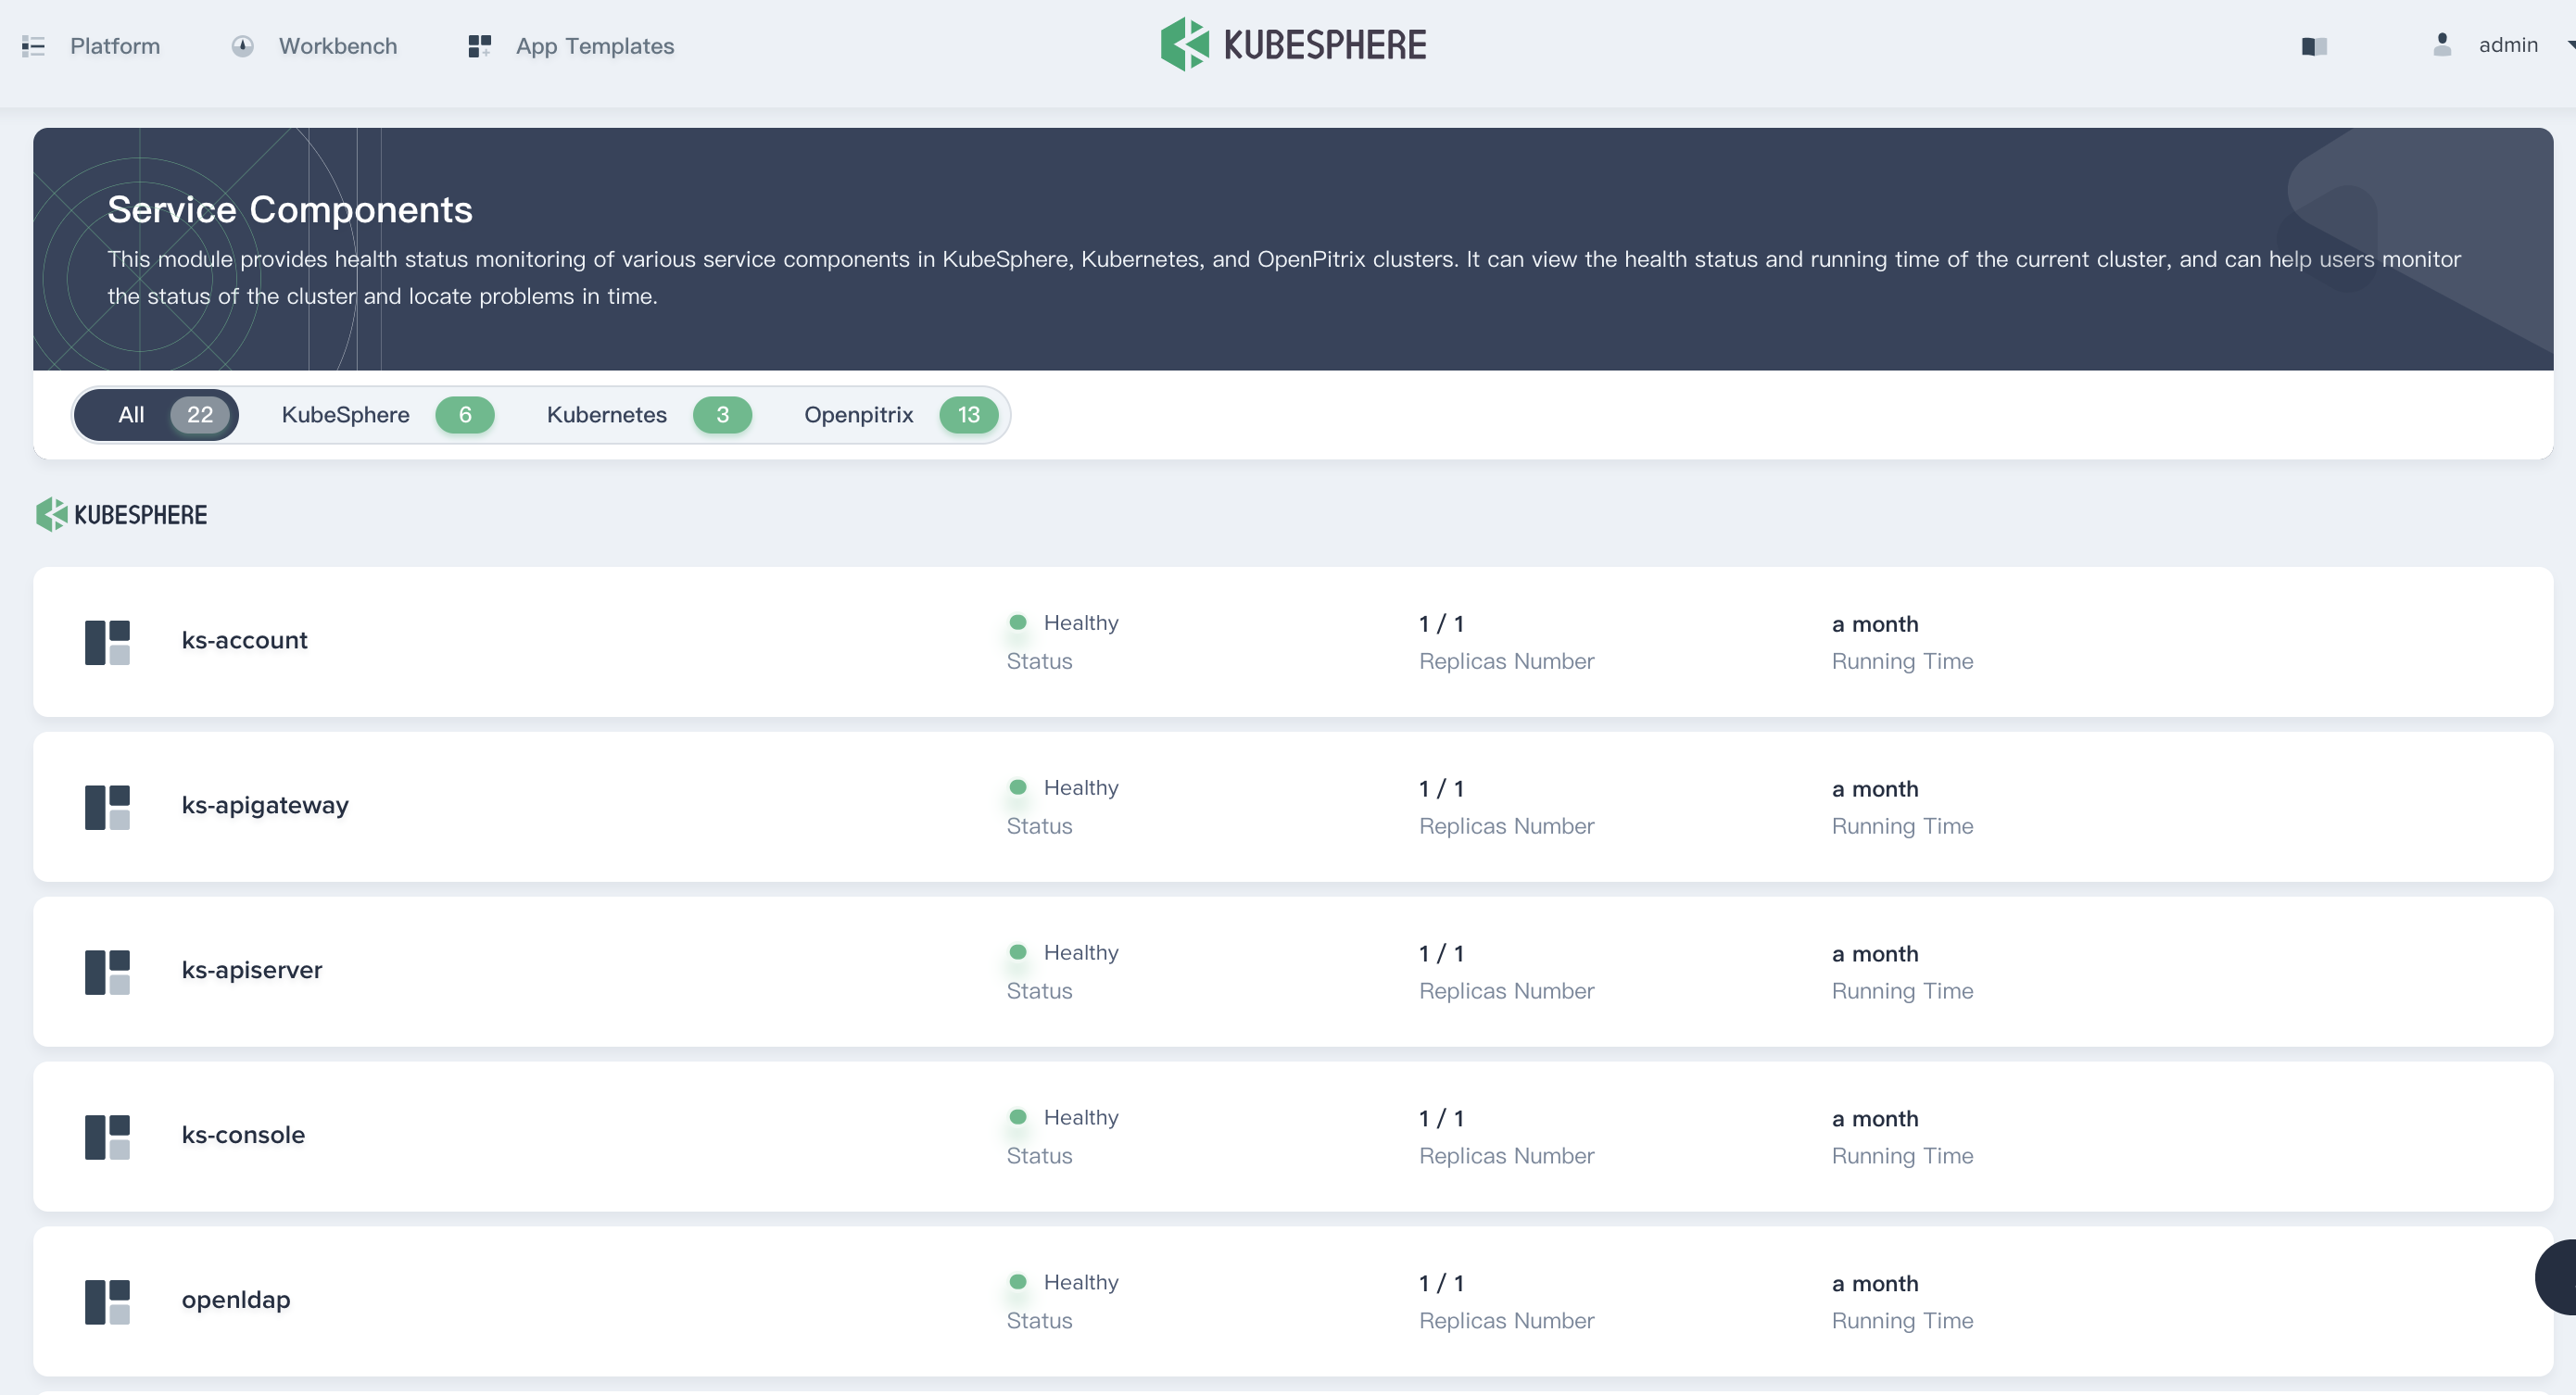
Service Components Status
The service component provides health status monitoring for various service components within KubeSphere, Kubernetes, and OpenPitrix. If some core service components are abnormal, the system may become unavailable. Viewing the health status and running time of the service components can help users monitor the status of the cluster and locate problems in time.
You can choose Platform → Service Components to direct to the Service Components page.
Note that if any of the service components are abnormal, it will display yellow in its tab.
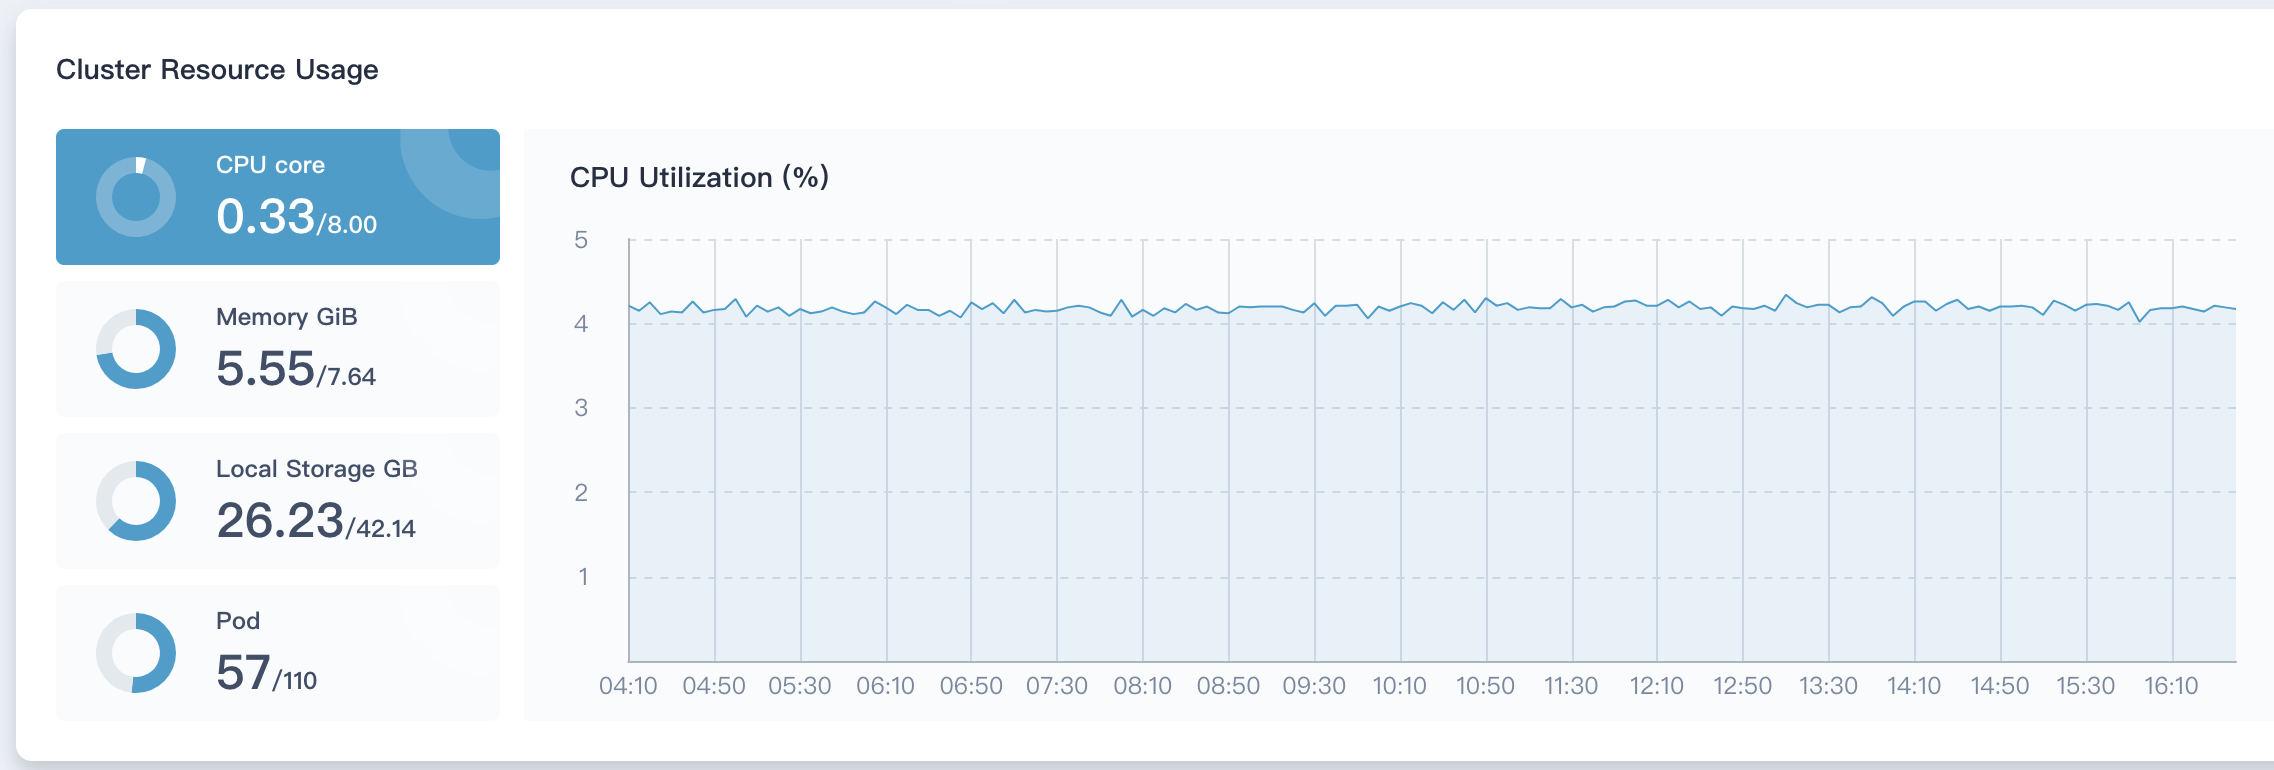
Cluster Resource Status
The monitoring indicators of the cluster resources include the CPU, memory, disk utilization of all nodes in the current cluster and the number of containers used. Click the circular diagram on the left to switch the monitoring items. The monitoring interval is 40 minutes, and the ordinates of the four monitoring indicators change dynamically with time.
The monitoring graph displays the resource digestibility of the entire cluster. For the cluster administrator, it is necessary to pay close attention to this part of the monitoring indicators. When the resources are close to saturation, you can adjust the load capacity of the cluster by adding nodes or expanding disks and memory.
Historical Monitoring
Change the tab to Historical Monitoring to view the running status tendency graph.
Historical monitoring data can help users observe and establish normal standards for resource and cluster performance. KubeSphere supports monitoring data within 7 days of cluster physical resources, including CPU utilization, memory utilization, and CPU load average (1 minute / 5 minutes / 15 minutes), inode utilization (%), disk throughput (read/write), IOPS (read/write), Network Banwidth (out/in), Pod status.
KubeSphere also supports custom time ranges and time intervals to view historical monitoring status.

Then we will briefly introduce the meaning of each monitoring indicator.
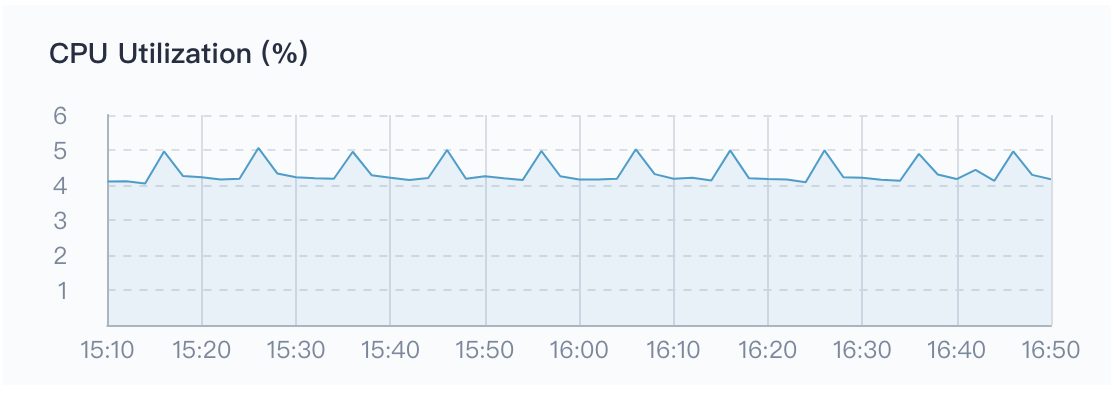
CPU Utilization
CPU utilization (%) is a count of CPU usage over a period of time. This indicator shows how the CPU is occupied during a certain period of time. If you find that the CPU usage of the system is high during a certain period of time, you must first locate which process is occupying a higher CPU. For example, for Java applications, there may be memory leaks or dead loops in the code.
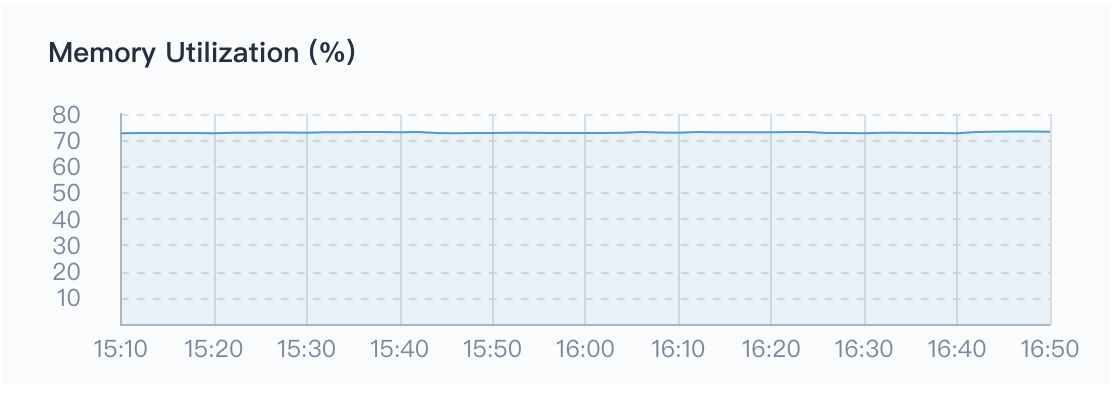
Memory Utilization
Memory is one of the important components in a computer, so the performance of the memory has a great impact on the computer. The data load, thread concurrency, I/O buffer, etc. of the program runtime depend on the memory. The size of the available memory determines whether the program can run normally and the performance of the operation, the memory utilization (%) can reflect the memory utilization and performance of the cluster.
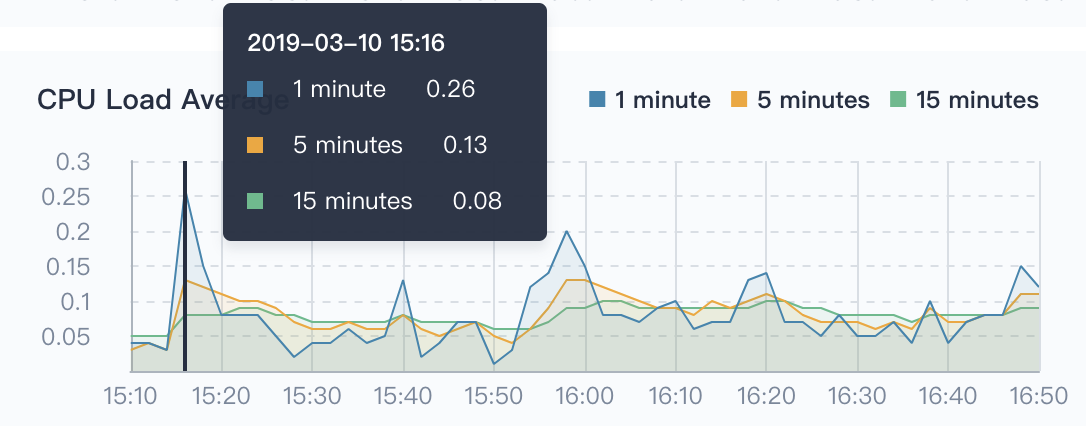
CPU Load Average
It is the average number of processes in the system that can be run and uninterruptible in unit time, that is, the average number of active processes. Note that there is no relationship between CPU load average and CPU usage. Direct relationship. So what is the load average?
In fact, the load average should ideally be equal to the number of CPUs, so when determining the load average, it's supposed to first determine that how many CPUs the system has. When the load average is more than the number of CPUs, the system is overloaded.
The problem is that the average CPU load is divided into three values of 1 minute / 5 minutes / 15 minutes in the figure below. What should we look at?
Generally, you should inpect three times. By analyzing the trend of system load, you can get a more complete understanding of the current load situation:
- As for 1 minute / 5 minutes / 15 minutes, if the curves of these three times are basically similar in a certain period of time, indicating that the CPU load of the cluster is stable.
- If the value of 1 minute at a certain time period (or time point) is much higher than 15 minutes, it means the load of the last 1 minute is increasing and needs to be observed. Once the value of 1 minute exceeds the number of CPUs, it may mean that the system appears overload, you need to further analyze the source of the problem.
- Conversely, if the value of 1 minute at a certain time is much less than 15 minutes, the CPU load is decreasing in the last 1 minute, also means the CPU load has been generated in the previous 15 minutes.
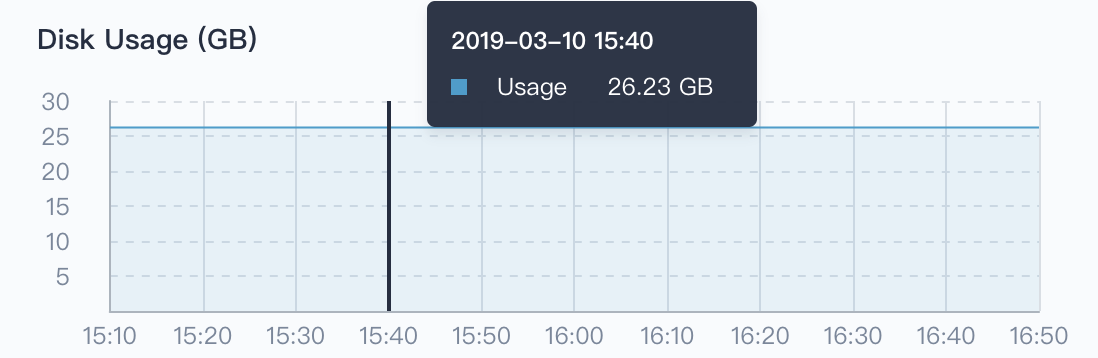
Disk Usage
Workloads, such as StatefulSets and DaemonSets, rely on persistent storage services, and some of their own components and services also require persistent storage support, and such backend storage relies on disks (e.g. block storage or network shared storage). Providing a real-time monitoring for disk usage is an important part of maintaining high data reliability. Since in the day-to-day management of Linux systems, cluster admin may experience data loss due to insufficient disk space, or even system crashes. Therefore, it's crirical to pay attention to the system's disk usage and ensure that the file system is not occupied or abused. If you find that the disk usage is too high, you can save disk space by cleaning up unnecessary images.
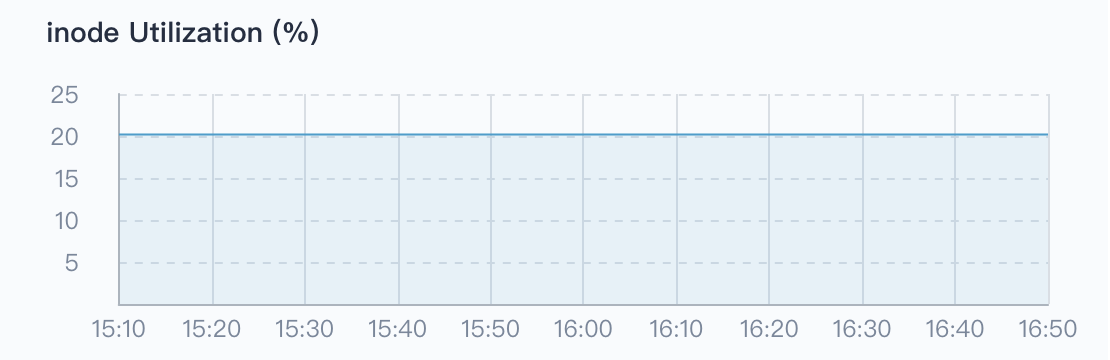
inode Utilization
Each file must have an inode to store the meta information of the file, such as the creator of the file, the date of creation, the inode also consumes hard disk space, and a large number of cache small files can easily cause the inode resources to be exhausted. Also, it is possible that the inode has run out, but the hard disk is not full, in that case it's impossible to create a new file on the hard disk.
The monitoring of inode usage can just discover the above-mentioned situations in advance, help cluster admin to know the usage of the cluster inode, as well as prevent the cluster from working properly due to the exhaustion of the inode, and prompt the admin to clean up the temporary files in time.
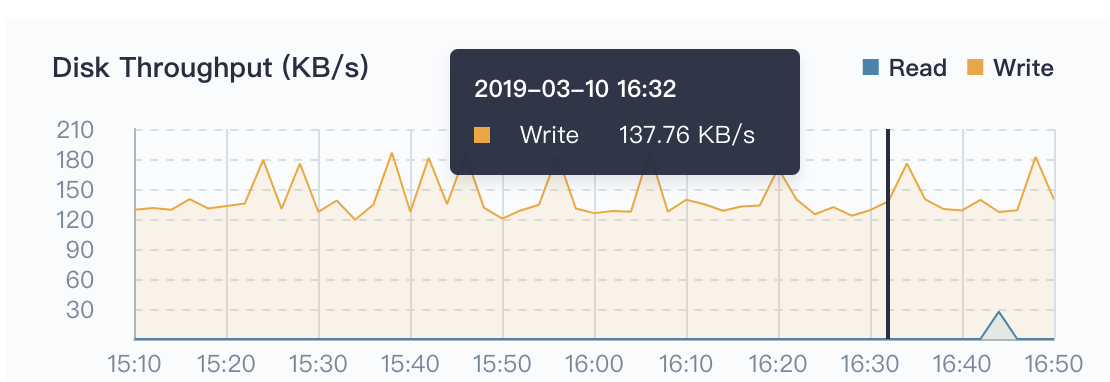
Disk Throughput
The above mentioned disk utilization monitoring, disk throughput and IOPS monitoring are also indispensable, so that cluster admin can adjust the data layout and other management activities to achieve optimize the overall performance of the cluster.
Throughput refers to the speed at which a disk transfers data streams in MB/s. The transmitted data is the sum of read and write data. This indicator has an important reference role when transferring large pieces of discontinuous data.
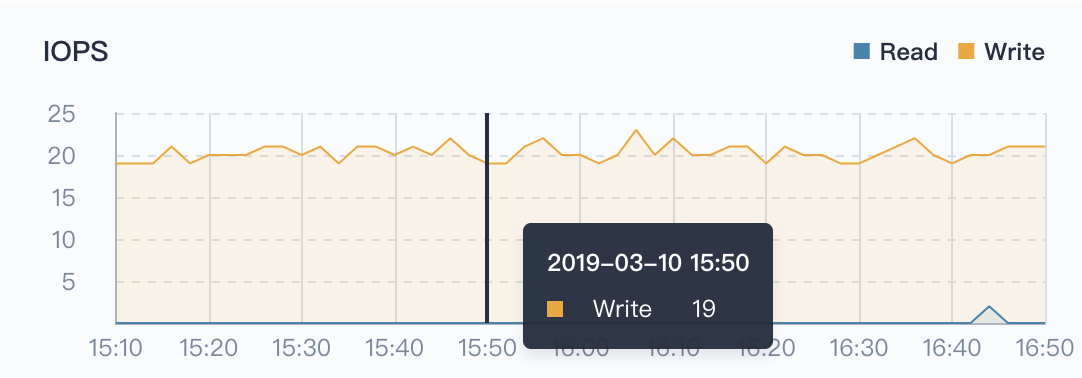
IOPS
For a disk, a sequential read or sequential write of a disk is called a disk I/O. The IOPS of a disk is the sum of the number of consecutive reads per disk and the number of consecutive writes per second. This indicator has important reference significance when transmitting small pieces of discontinuous data.
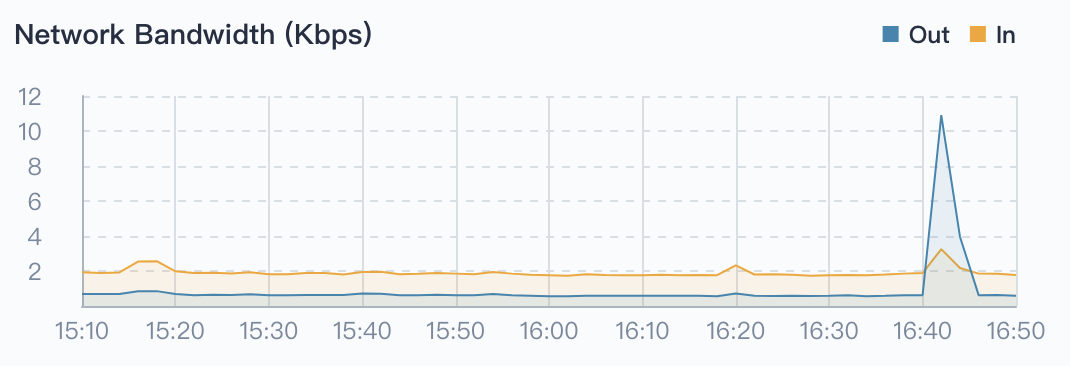
Network Bandwidth
The Network Bandwidth refers to the ability of the network card to receive or send data every second, in Mbps (megabits per second).
Pod Running Status
Pod running status supports filtering the total number of Pod in the three states, i.e. Running, Warning, Completed. The completed state is usually a Pod such as a Job or CronJob, and the number of Pods in the warning state needs special attention.
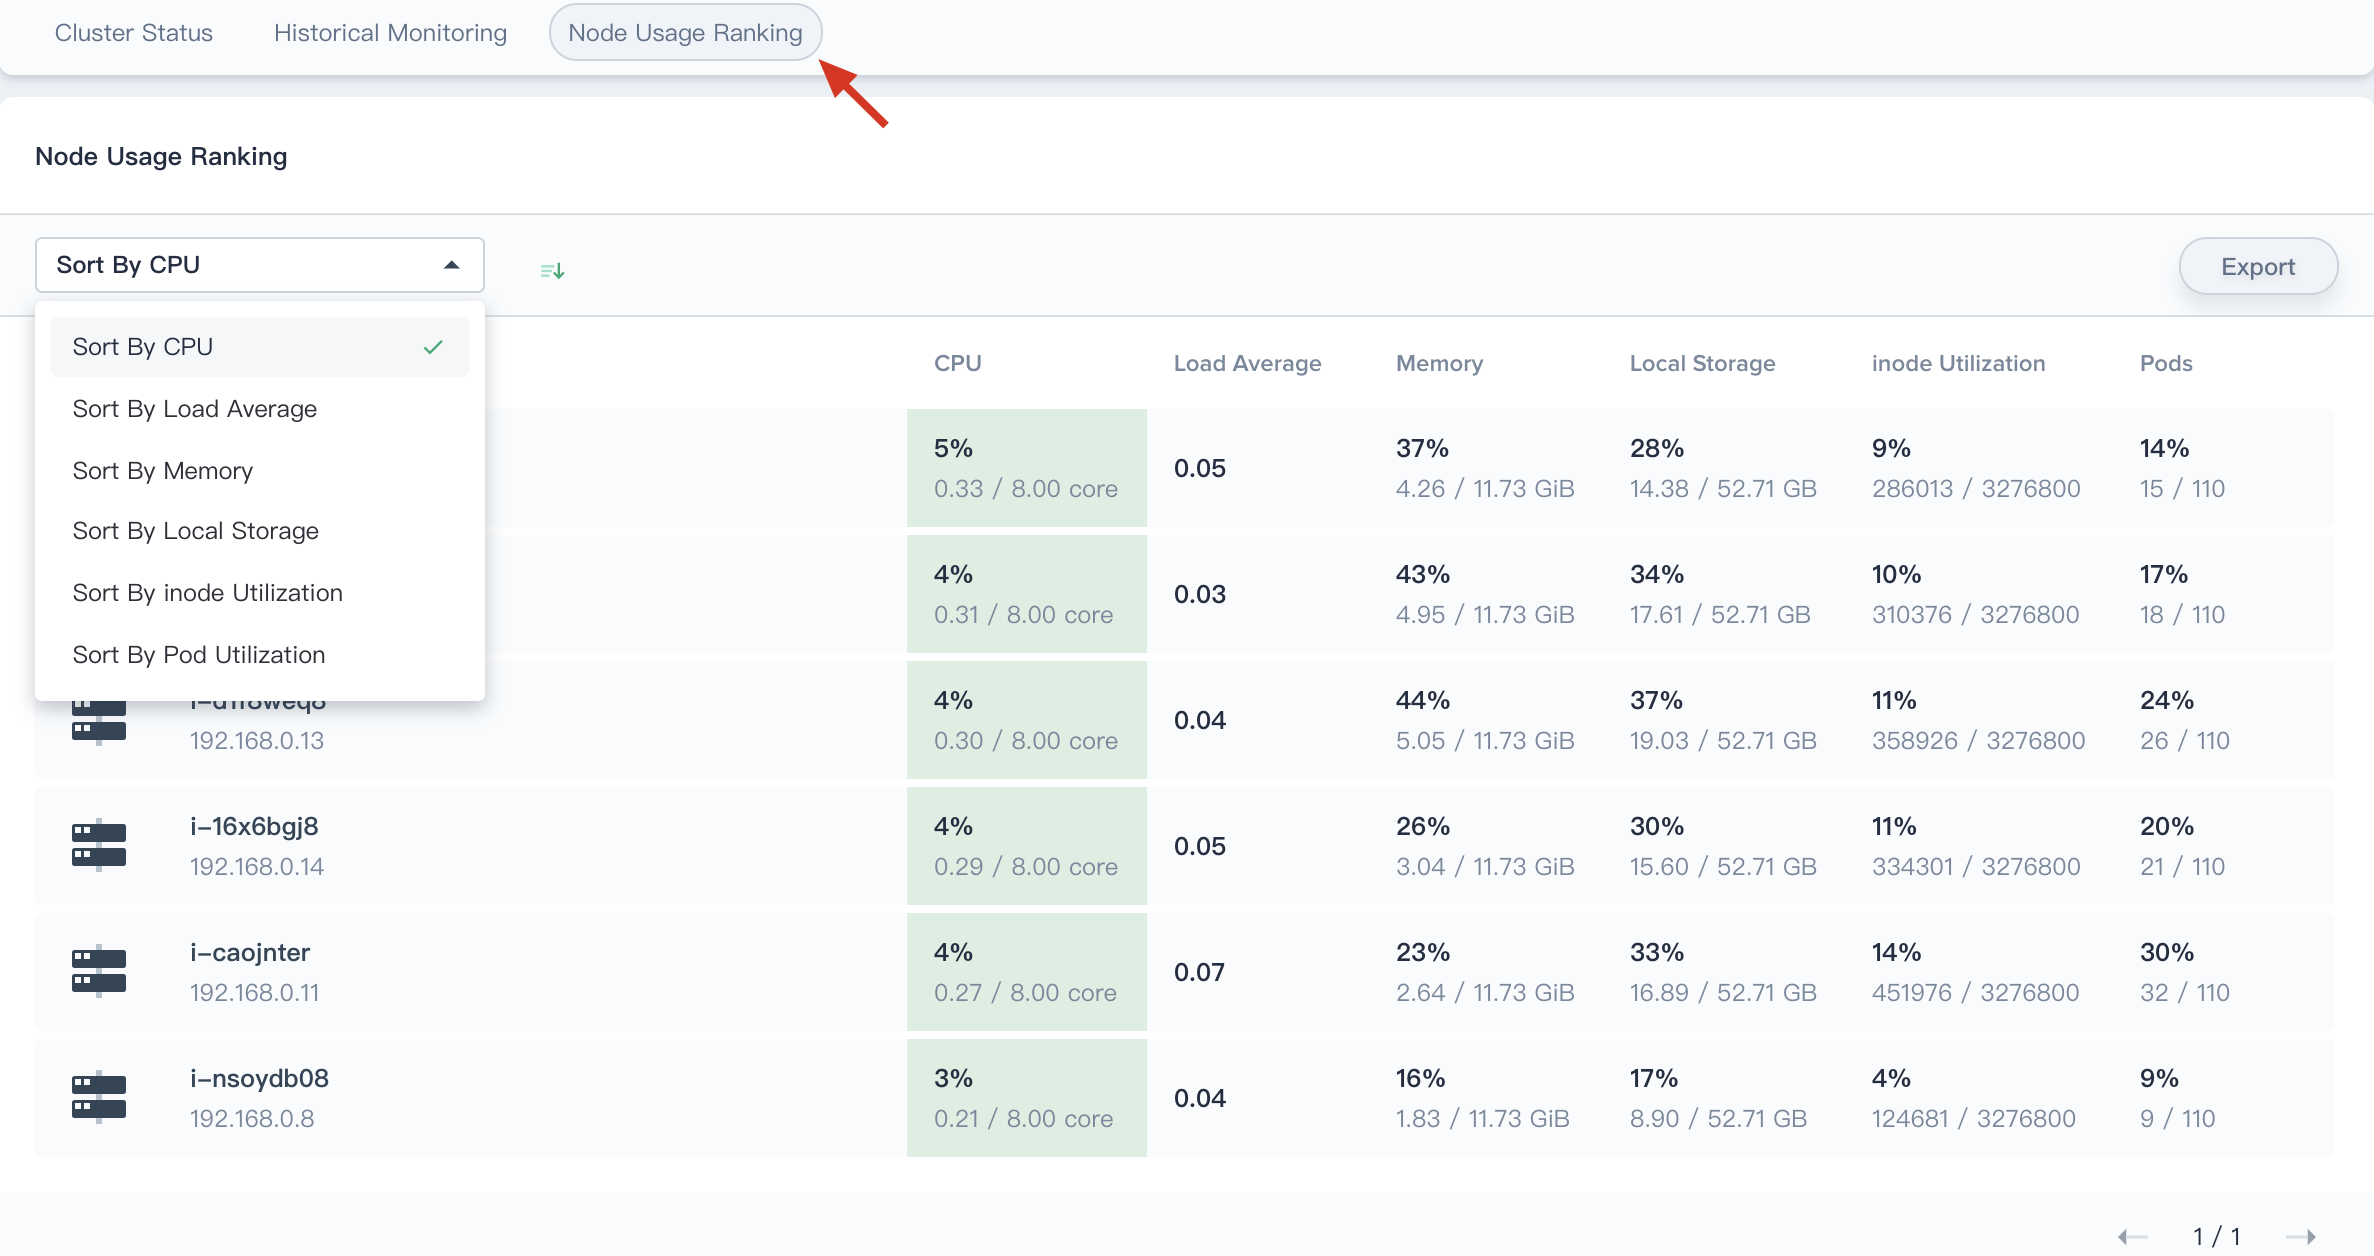
Node Usage Ranking
The node usage ranking is very useful for node monitoring. It supports ranking by CPU usage, CPU average load, memory usage, local storage usage, inode utilization, and Pod utilization. By sorting in ascending and descending order, cluster admin can quickly identify potential problems or locate a node with insufficient resources.