Installation
Intruction
Install on Linux
Install on Kubernetes
Related Tools
Cluster Operation
Quick Start
Cluster Admin Guide
Multi-tenant Management
Platform Management
Infrastructure
Monitoring Center
User Guide
Storage
Configuration Center
Project Settings
Development Guide
API Documentation
Create a CI/CD Pipeline in a Graphical Panel
From last CI/CD tutorial, the pipeline was built from existing Jenkinsfile of its source code repository, requiring some experiences of the declarative Jenkinsfile. For beginners, who prefer graphical panel to help them quickly create a CI/CD pipeline without Jenkinsfile. Luckily, KubeSphere enables users to build a pipeline in a graphical panel, as well as generate a pipeline to Jenkinsfile which allows users to edit, friendly UI manipulation which makes a team’s delivery in high efficiency.
Objective
This guide is based on guide 10-Jenkinsfile in SCM. By building the pipeline in a visual way, deploy a HelloWorld sample service to a development environment in a KubeSphere cluster. Besides, that is accessible to users. The so-called development environment is resource isolated in Namespace in the underlying Kubernetes. For presentation purpose, this example still uses the GitHub repository devops-java-sample.
Hands-on Lab
Pipeline Overview
The construction of visual pipeline consists of the following six stages. Firstly, the flowchart below briefly describes the workflow of the entire pipeline:
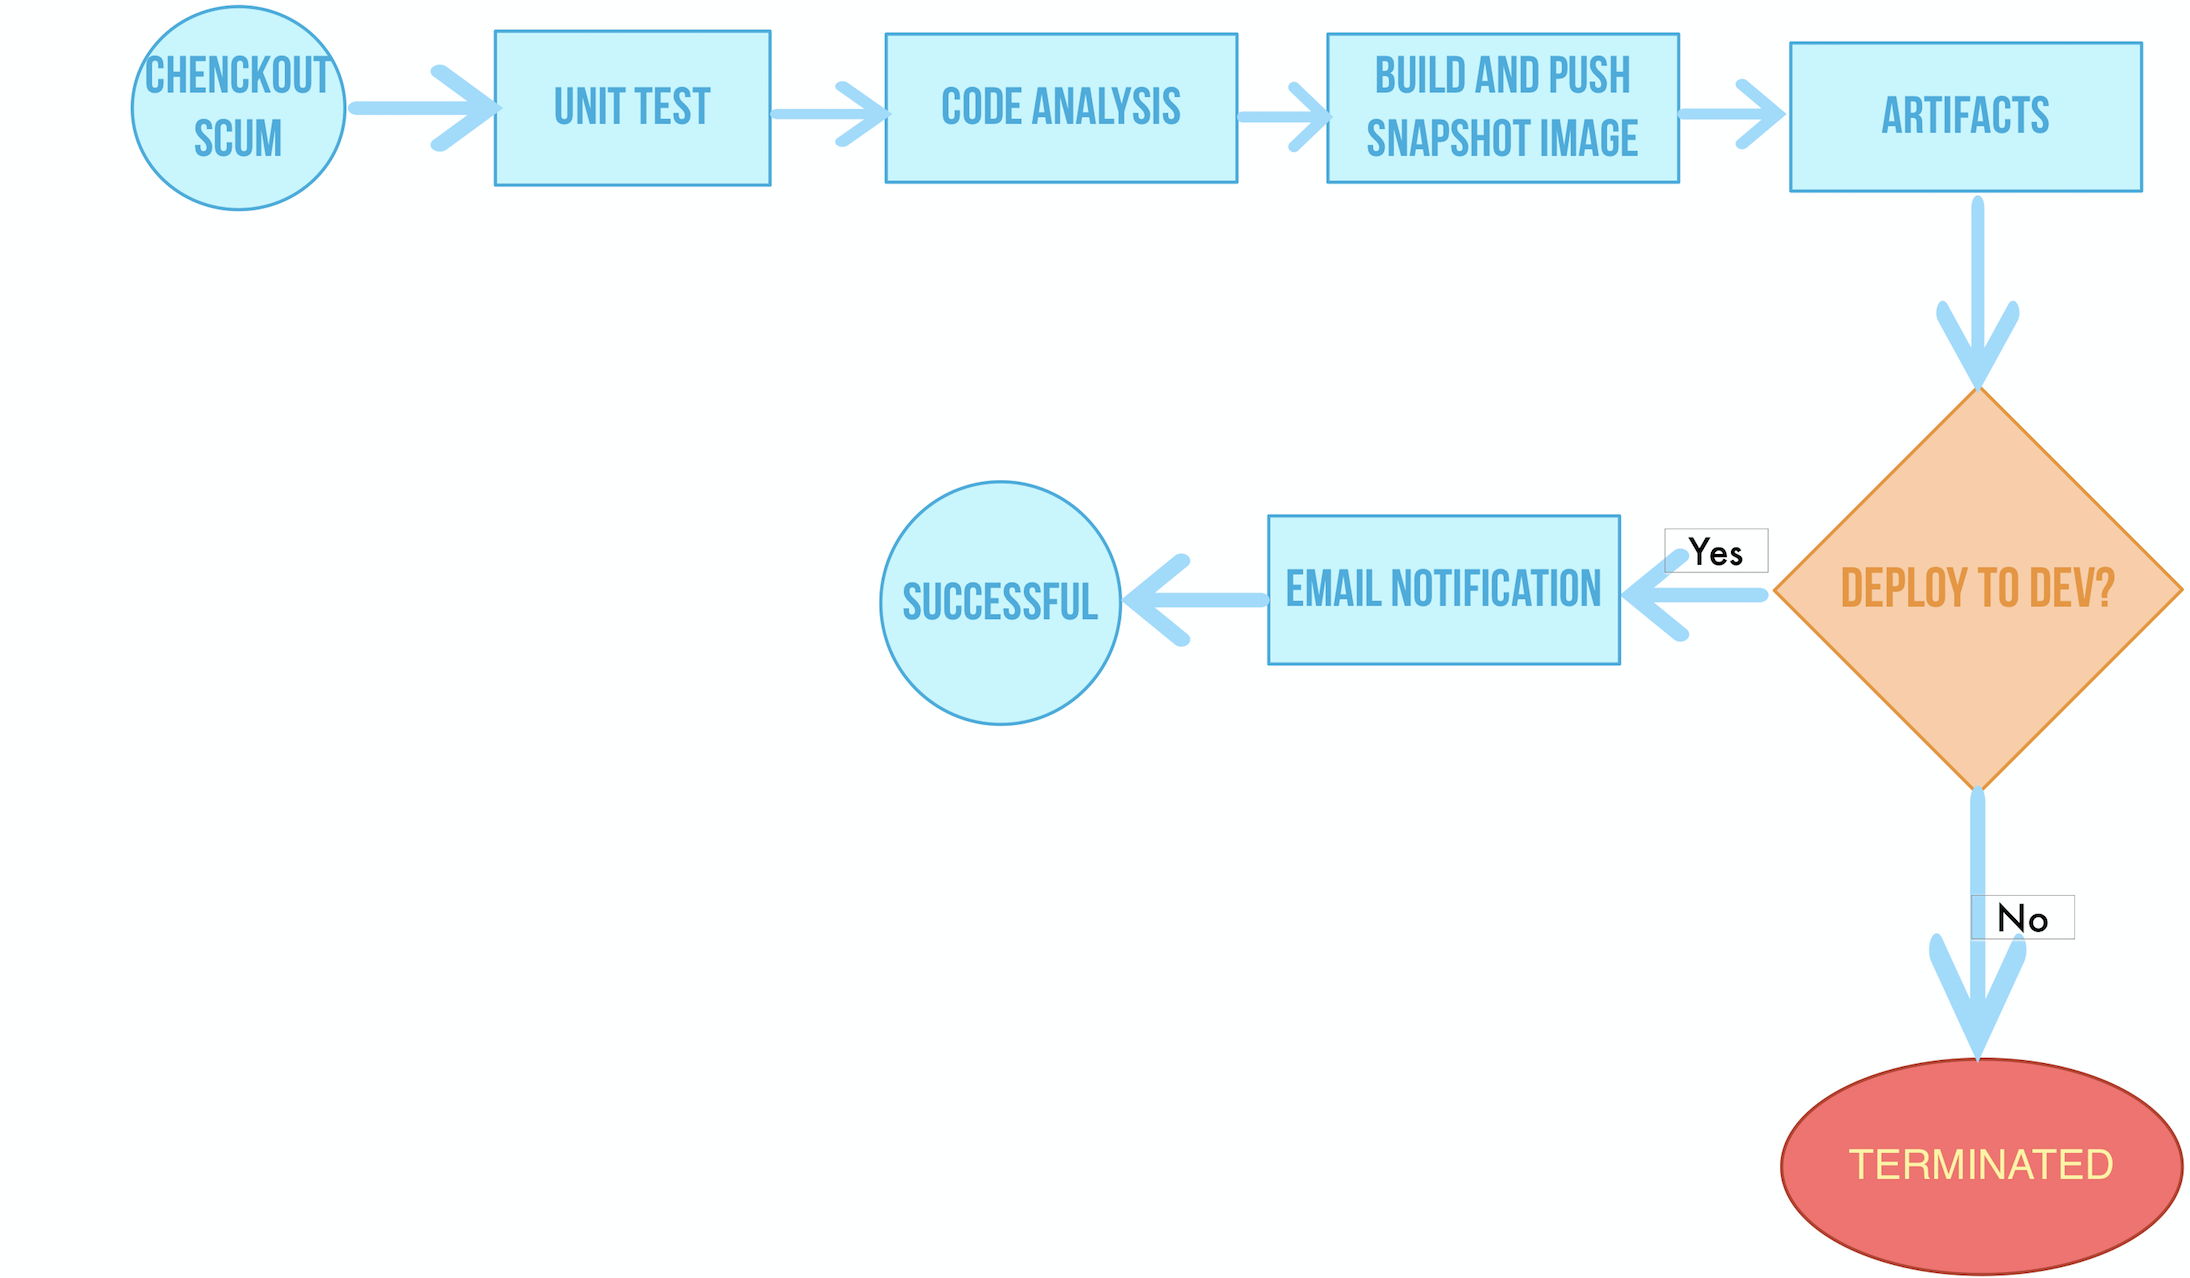
The explanation of every stage:
- **Stage 1. Checkout SCM: **Pull the GitHub repository code;
- Stage 2. Unit test: Unit tests; proceed to the next task only if the tests are passed;
- Stage 3. Code Analysis: Configure SonarQube for static code quality checking and analysis;
- Stage 4. Build and Push: Build the image and push the tag as snapshot-$BUILDNUMBER to DockerHub (where $BUILDNUMBER is the run number of the pipeline active list);
- Stage 5. Artifacts: Make the artifact (jar package) and save it;
- Stage 6. Deploy to DEV: Deploy the project to the Dev environment, which requires a pre-audit and an email if the deployment is successful.
Create Project
CI/CD pipeline will eventually deploy the sample Web to the development environment kubesphere-sample-dev based on the yaml 模板文件 of the documentation website. It corresponds to a project in KubeSphere that needs to be created in advance. If not please refer to 示例十 - 创建第一个项目; use a project-admin account to create a kubesphere-sample-dev project. Then invite project regular user project-regular to enter the project and give it an operator character.

Create Credentials
This example creates pipelines with DockerHub, Kubernetes (create KubeConfig to access the running Kubernetes cluster), and SonarQube (three Credentials).
-
Log in KubeSphere with the project regular user. Refer to Create Credentials create the credential of DockerHub and Kubernetes. Name the credential ID as
dockerhub-idanddemo-kubeconfig. -
Create a Java Token refer to 访问 SonarQube and copy the Token。
-
Lastly, enter devops-demo's DevOps project in KubeSphere. Similarly, click Create in the Credential, to create a Secret Text type credential. Name the credential ID as
sonar-token, the token is the one copied in the previous step, then click Confirm.
At this point, the three credentials have been created and will be used in the pipeline.

Create Pipeline
Follow steps below to create and run a complete pipeline.
Step 1: Fill in the basic information
- In the DevOps project, select the Pipeline on the left and click Create.

-
In the pop-up window, enter the basic information of the pipeline. When finished, click Next.
-
Name: A concise name for the pipeline to understand and search, for example, graphical-pipeline.
-
Description: A brief introduction to the main features of the pipeline to help you understand the role of the pipeline.
-
Code Registry: No code registry is selected here.

Step 2: Advanced Settings
- Click Add Parameter to add 3 string parameters as follows. This parameter will be used in the docker command of the pipeline. Click OK when done. | Parameter Type | Name | Default Value | Description | | --- | --- | --- | --- | | string parameter | REGISTRY | The sample repository address is docker.io. | Image Registry | | string parameter | DOCKERHUBNAMESPACE | Fill in your DockerHub account (which can also be the Organization name under the account). | DockerHub Namespace | | string parameter | APPNAME | Fill the application name as devops-sample. | Application Name |

Visual editing pipeline
The visualization pipeline consists of six stages, which in turn describe which steps and tasks were performed in each stage.
Stage 1: Pull Source Code (Checkout SCM)
The visual editing page is divided into a structure editing area and a content editing area. Jenkinsfile is automatically generated by building each stage and step of the pipeline, so users don't need to learn the syntax of Jenkinsfile, which is very convenient. Of course, the platform also supports the manual editing of Jenkinsfile. The pipeline is divided into "declarative pipeline" and "scripted pipeline". Visual editing supports declarative pipeline. For Pipeline syntax, see Jenkins 官方文档.
- As follows,select
nodein the agent type, inputmavenin the label.
Note: The Agent section specifies where the entire Pipeline or a particular stage will be executed in the Jenkins environment, depending on where the agent part is placed, see Jenkins Agent 说明。
- In the graphical build pipeline interface, click the "+" button in the edit area on the left side. Add a stage. Click the Add Step in the interface, and name it Checkout SCM in the right input box.

3、Then click Add steps at this stage. Select git on the right. For now, pull the repository's codes through Git, and the information filled in the pop-up window is as follows:
- Url: GitHub repository URL
https://github.com/kubesphere/devops-java-sample.git - Credential ID: No need to fill in (if it is a private warehouse, such as Gitlab, you need to create and fill in the voucher ID in advance)
- Branch: There is no need to fill in the branch name here. If not, the default is the master branch.
When you are done, click "OK" to save and you will see the first stage of the build pipeline.

Stage 2: Unit Test
- Click "+" on the right of the
Checkout SCMto add one stage for performing a unit test in the container, name itUnit Test。

- Click
Addand selectthe Pod, name itmaven, then clickConfirm;

3、Click Add nesting steps in the maven pod. Then select shell and enter the following command in the popup window, then click Save:
mvn clean -o -gs `pwd`/configuration/settings.xml test
Stage 3: Code Analysis
-
Same as above, click “+” on the right side of the
Unit Teststage to continue adding a stage for configuring SonarQube to perform static code quality analysis in the container, name itCode Analysis。 -
Click
Addand selectthe Pod,name itmaven,then clickConfirm。 -
Click
Add nesting stepson the right and selectAdd credentials,Select the previously created credential IDsonar-tokenin the popup window inputSONAR_TOKENin the text variable, then click Confirm.

- In the Add Credential on the right,click
Add nesting steps,then selectSonarQube configuration,keep the default name sonar,click Confirm。

- Click
Add nesting stepsin theSonarQube configuration. SelectShellon the right, enter the SonarQube branch and authentication configuration commands in the pop-up window as follows, and click confirm to save the information.
mvn sonar:sonar -o -gs `pwd`/configuration/settings.xml -Dsonar.branch=$BRANCH_NAME -Dsonar.login=$SONAR_TOKEN
- Click on the third
Addon the right and selectOvertime. Input 1 to time and the unit selectHour. Click Confirm.

- In the overtime steps, click
Add nesting steps. SelectCode quality Cehck (SonarQube)and keep the defaultProcess the following job after pass the testin the popup window then click Confirm.

Stage 4: Build and Push the Image
-
Click "+" on the right of the stage of
Code Analysisto add another stage to build and push images to DockerHub. Name it asBuild and Push。 -
Click
Add stepsand selectThe Pod,name it asmaven,then clickConfirm. -
Click
Add nesting stepsand selectShellon the right, enter the following command in the popup window:
mvn -o -Dmaven.test.skip=true -gs `pwd`/configuration/settings.xml clean package- Then continue to click
Add nesting stepson the right, selectShell. In the popup window, enter the following command to build a Docker image based on the Dockerfile in the repository. Click Finish to save when done:
docker build -f Dockerfile-online -t $REGISTRY/$DOCKERHUB_NAMESPACE/$APP_NAME:SNAPSHOT-$BUILD_NUMBER .- Click
Add nesting stepsand selectAdd credentialson the right. Fill the following information in the popup window, and click "confirm" to save the information:
Note: For users' information security, the account type information does not appear in the script in clear text, but in the form of variables.
-
Credential ID:Select the DockerHub credentials you created earlier such as
dockerhub-id -
Password variable:
DOCKER_PASSWORD -
Username variable:
DOCKER_USERNAME -
Click
Add nesting stepsin theAdd credentialsstage, selectShellon the right, enter the following command in the popup window to log in to Docker Hub:
echo "$DOCKER_PASSWORD" | docker login $REGISTRY -u "$DOCKER_USERNAME" --password-stdin7、Then click Add nesting steps to add Shell input a command to push the SNAPSHOT image to Docker Hub:
docker push $REGISTRY/$DOCKERHUB_NAMESPACE/$APP_NAME:SNAPSHOT-$BUILD_NUMBER
Stage 5: Save Artifacts
-
Click "+" at right of the
Build and Pushstage to add another stage to protect artifacts. This example uses the jar package asArtifacts. -
Click
Add stepsand selectSave Artifacts. Inputtarget/*.jarin the popup window to capture the build file containing the pattern match (target/*.jar) and save it to Jenkins,then click Confim.

Stage 6: Deploy to DEV
-
Click "+" at right of the
Artifactsstage to add the last stage and name it asDeploy to DEV. This stage will be used to deploy pod image to development environment namely, the project ofkubesphere-sample-dev. -
Click
Add stepsand selectReview. Input@project-adminin the pop-up window and demand the project-admin account to review the pipeline. Click Confirm. -
Click
Add steps,selectKubernetesDeploy. Fill in the pop-up window as below and click "Confirm" to save the information: -
Kubeconfig: select
demo-kubeconfig -
Configuration file path: Input
deploy/no-branch-dev/**which is the according path of the Kubernetes source deployment's yaml 文件. -
Add a step to the same as above to send a notification email to the user after this step of deployment and pipeline execution is successful. Click
Add steps, selectEmail, and custom edit recipients, CCs, topics, and content.
Note: sending mail in the pipeline requires pre-installing the mail server in the Installer. Please refer to 集群组件配置释义 for configuration. If not already configured, skip step 4 (the next version will support the unified configuration of mail in the UI after installation server).

At this point, the six stages of the graphical pipeline building have been added successfully, click Confirm → Save,the pipeline of the visual build is created and the Jenkinsfile is also generated.
Run Pipeline
1、Manually built pipelines need to be manually run in the platform. Click Run,In the input parameter pop-up window, you can see the three string parameters defined earlier. No modification is needed here. Click Confirm and the pipeline will start running.

2、You can see the status of the pipeline in the Activity list,click Activity to view the specific situation of the activity.
Note: The pipeline cannot be seen when it is started. This is because it has an initialization process. When the pipeline starts running, the Jenkins slave starts and starts parsing and executing the Jenkinsfile automatically generated by the pipeline. You can see the page where the graphical pipeline runs.
- Click Run Sequence
1in the activity list to enter the activity details page of Sequence1to view the specific operation of the pipeline.

- Log in the platform and shift the user to
project-admin. Enter into thegraphical-pipelineunder the DevOps project. Then clickActivityto enter the No.1activity page. You can see the pipeline has run to thedeploy to devstage. ClickContinueto change the pipeline status as In Operation.
Note: If the previous steps are configured correctly, you can see that the pipeline has successfully run to the last stage in a few minutes. Since we added the review step in the last phase and specified the user with the user name
project-admin. Therefore, the pipeline will be suspended until now, waiting for the auditorproject-adminto log into the pipeline running page to manually trigger. 此时审核者可以测试构建的镜像并进一步审核整个流程,若审核通过则点击 继续,最终将部署到开发环境中。

View Pipeline
- After a few minutes, the pipeline will run successfully. Click
Activitylist in the pipeline to view the current running pipeline serial number, the page shows the operational status of each step in the pipeline. The black box marks the name of the step in the pipeline. The six stages of the pipeline in the example are the six stages created above. At this point, the reviewer can test the built image and further review the entire process. If the review is approved, click Continue and the solution will eventually be deployed to the development environment.

- Click
Check Logson the top right of the current page to view the pipeline run log. The page shows the specific log, running status and time of each step. Click on a specific stage on the left to view its specific log. If an error occurs, the positioning problem can be analyzed according to the log information. The log can be downloaded to the local view. .

View code quality
Click Code quality in the pipeline to check the detection results of the code quality, which is provided by the SonarQube built into the cluster. The sample code is simple and therefore does not show bugs or code vulnerabilities. Click on the SonarQube icon on the right to access SonarQube in your browser and visit SonarQube for reference 访问内置 SonarQube.
Tip: If you need to access SonarQube on the external network, you may need to bind the public network EIP and configure port forwarding and firewall rules. In the port forwarding rule, the intranet port, for example, 31359, is forwarded to the source port 31359, and then open the source port in the firewall to ensure that the external network traffic can pass through the port before the external can access. For example, if you are doing the above operations on the QingCloud cloud platform, you can refer to 云平台配置端口转发和防火墙。

View test quality report at SonarQube

View Articraft
Click Activity and select Product, you can view the articraft Jar package saved by the pipeline during the running process, and click to download it to the local.

Verify the results of the process
If every step of the pipeline can be successfully executed, the Docker image of the final build of the pipeline will also be successfully pushed to DockerHub. We have configured the Docker mirror repository in Jenkinsfile, log in to DockerHub to see the mirror's push result, and you can see the tag. The image for SNAPSHOT-xxx has been pushed to DockerHub. It was finally deployed to the development environment as a deployment and service in KubeSphere.
- Login KubeSphere as
project-regular, enterkubesphere-sample-dev, click Workload → Deployment on the menu bar on the left to see that ks-sample-dev has been created successfully. | Environment | URL | Namespace | Deployment | Service | | --- | --- | --- | --- | --- | | Dev |http://{$Virtual IP}:{$8080}orhttp://{$Intranet/Public IP}:{$30861}| kubesphere-sample-dev | ks-sample-dev | ks-sample-dev |
View Deployment
- In the menu bar, select Network & Services → Service. You can also view the corresponding created service. You can see that the NodePort exposed by the service is
30861.
View Service

- Check the mirror pushed to DockerHub you can see that
devops-sampleis the value of APP_NAME, while Tag is the value ofSNAPSHOT-$BUILD_NUMBER($BUILD_NUMBER, running number of the according activity), in which tag is the mirror ofSNAPSHOT-1, also used inks-sample-dev.

- Since we have set up email notifications in the final phase of the pipeline, we can verify the received build notification emails in the mailbox.

Access sample service
If you access to the deployed HelloWorld sample service in the intranet environment, you can log in to the cluster node through SSH. In another way, you can use the cluster administrator to log in to KubeSphere and enter the following command in web kubectl to verify access. The Virtual IP and node port (NodePort) can pass the corresponding project. View in the service:
# curl {$Virtual IP}:{$Port} or curl {$Intranet IP}:{$NodePort}
curl 10.233.4.154:8080
Hello,World!
At this point, the example of the graphical build pipeline has been completed. If you encounter problems during the creation process, you can refer to FAQ.