v2.0
v1.0
  1. Release Notes
    1. Release Notes - 2.0.2Latest
    1. Release Notes - 2.0.1
    1. Release Notes - 2.0.0
  1. Introduction
    1. Introduction
    1. Features
    1. Architecture
    1. Advantages
    1. Glossary
  1. Installation
    1. Intruction
      1. Intro
      2. Port Requirements
    1. Install on Linux
      1. All-in-One Installation
      2. Multi-Node Installation
      3. Installing HA Master and Etcd Cluster
      4. Storage Configuration Instruction
    1. Install on Kubernetes
      1. Prerequisites
      2. Online Installation
      3. Offline Installation
    1. Related Tools
      1. Integrating Harbor Registry
    1. Cluster Operation
      1. Adding New Nodes
      2. High Risk Operation
      3. Uninstalling KubeSphere
  1. Quick Start
    1. Getting Started with Multitenancy
    1. Exposing your APP using Ingress
    1. Deploying a MySQL Application
    1. Deploying a Wordpress Website
    1. Job to compute π to 2000 places
    1. Deploying Grafana using APP Template
    1. Creating Horizontal Pod Autoscaler
    1. S2i: Publish your app without Dockerfile
    1. Canary Release of Microservice APP
    1. CI/CD based on Spring Boot Project
    1. Building a Pipeline in a Graphical Panel
    1. CI/CD based on GitLab and Harbor
    1. Ingress-Nginx for Grayscale Release
  1. Cluster Admin Guide
    1. Multi-tenant Management
      1. Overview of Multi-tenant Management
      2. Overview of Role Management
    1. Platform Management
      1. Account Management
      2. Platform Roles Management
    1. Infrastructure
      1. Service Components
      2. Nodes
      3. Storage Classes
    1. Monitoring Center
      1. Physical Resources
      2. Application Resources
    1. Application Repository
    1. Jenkins System Settings
  1. User Guide
    1. Application Template
    1. Workloads
      1. Deployments
      2. StatefulSets
      3. DaemonSets
      4. Jobs
      5. CronJobs
    1. Storage
      1. Volumes
    1. Network & Services
      1. Services
      2. Routes
    1. Configuration Center
      1. Secret
      2. ConfigMap
      3. Image Registry
    1. Project Settings
      1. Basic Information
      2. Member Roles
      3. Project Members
      4. Internet Access
    1. DevOps Project
      1. DevOps Project Management
      2. DevOps Project Management
      3. DevOps Project Management
      4. DevOps Project Management
      5. DevOps Project Management
  1. Development Guide
    1. Preparing the Development Environment
    1. Development Workflow
  1. API Documentation
    1. API Guide
    1. How to invoke KubeSphere API
KubeSphere®️ 2020 All Rights Reserved.

Application Resources

In addition to monitoring the data from physical resource level, the cluster admin needs to know how many application resources, such as the number of projects and DevOps projects, as well as how many specific types of workloads and services has already been used in the platform. Application resource monitoring is a summary of the resource usage and trends of the application level of the platform.

Resource Usage

Choose Monitoring Center → Application Resources to enter the overview page of application resource monitoring, including the summary of the usage of all resources in the cluster, as shown in the following figure.

Resource usage

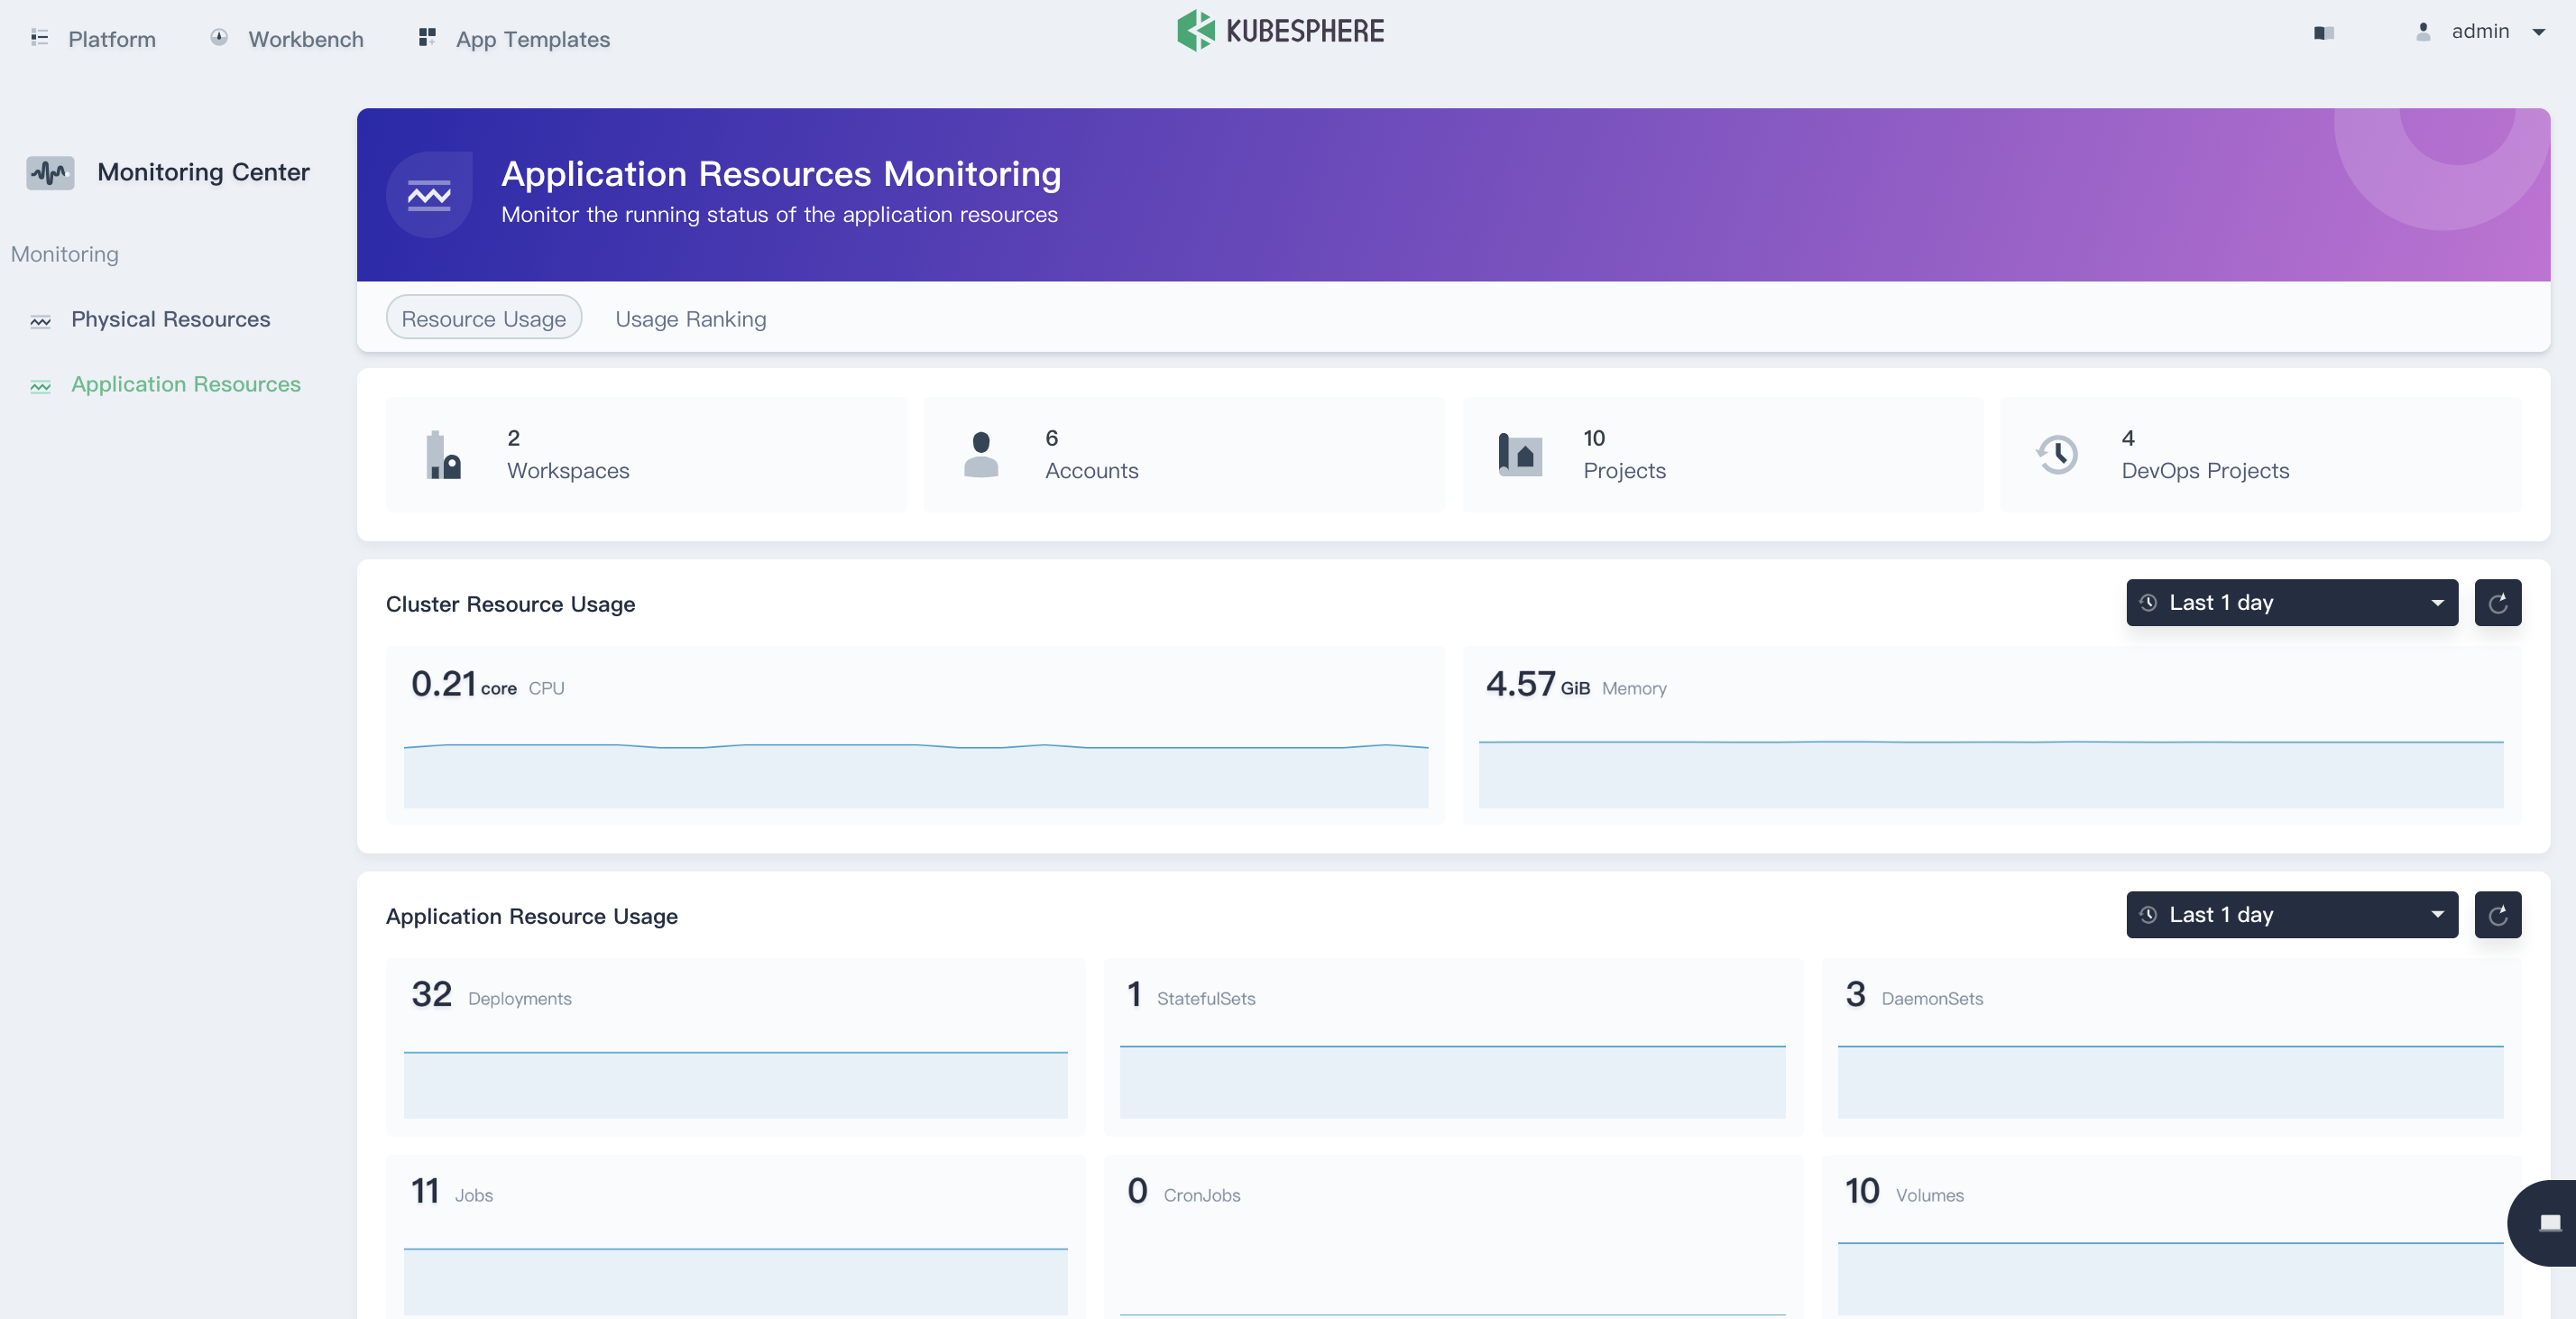
Among them, cluster resource usage and application resource usage will retain the monitoring data of the last 7 days, and support custom time range query.

Resource usage

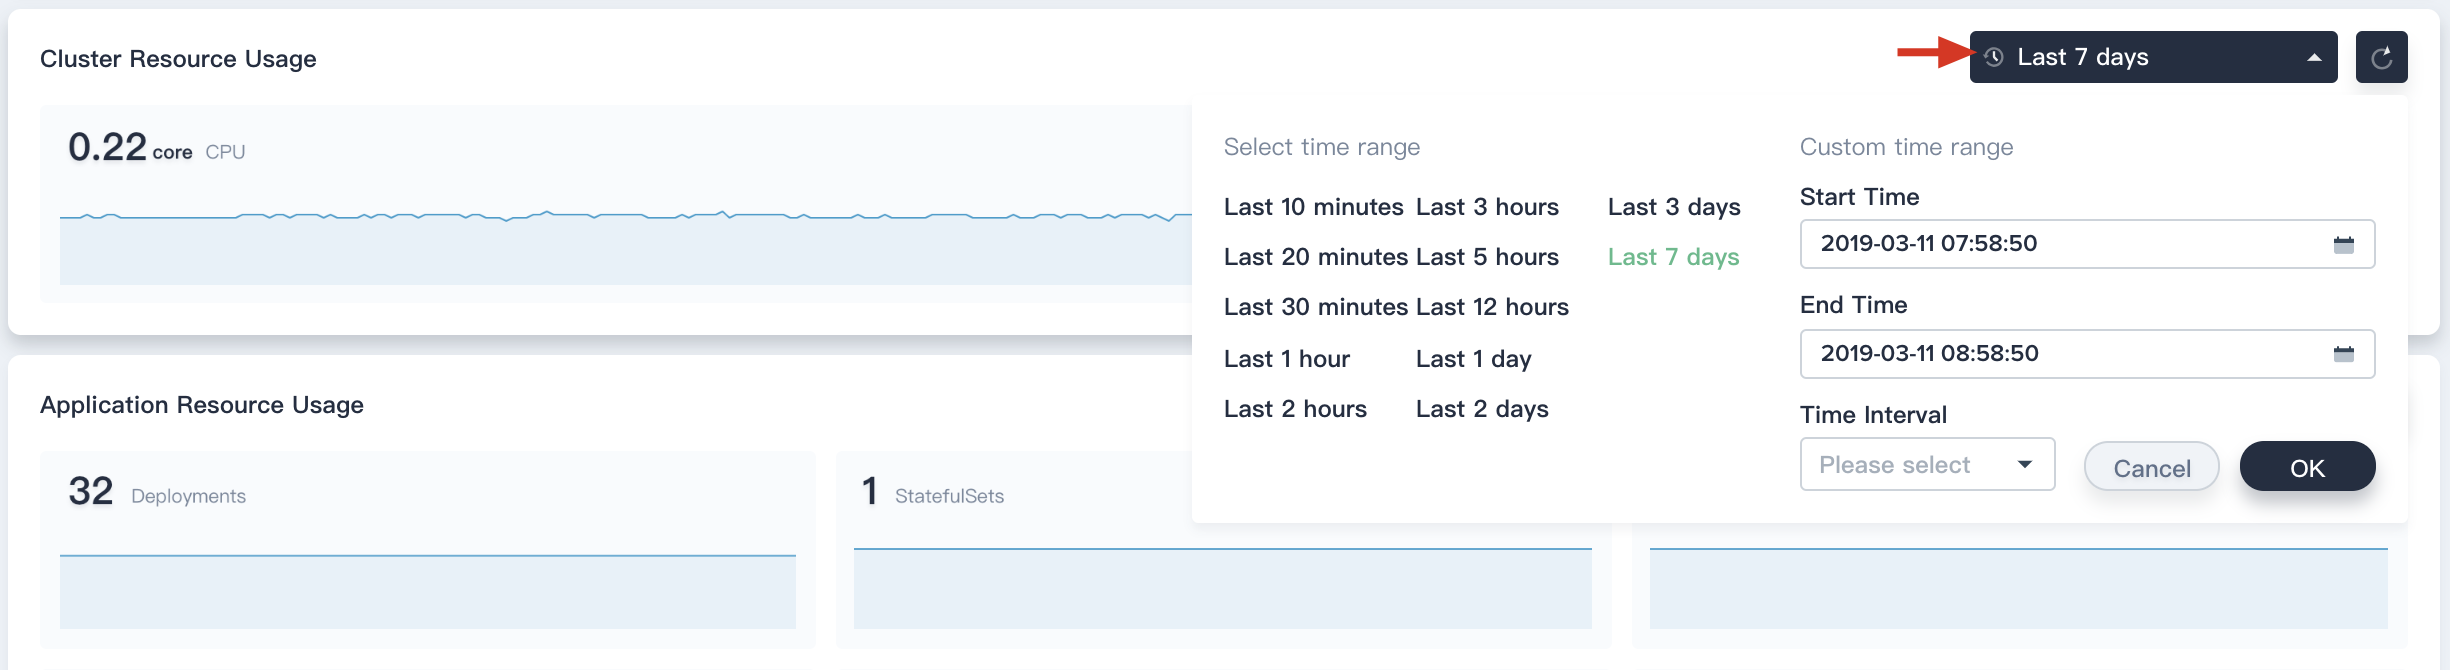
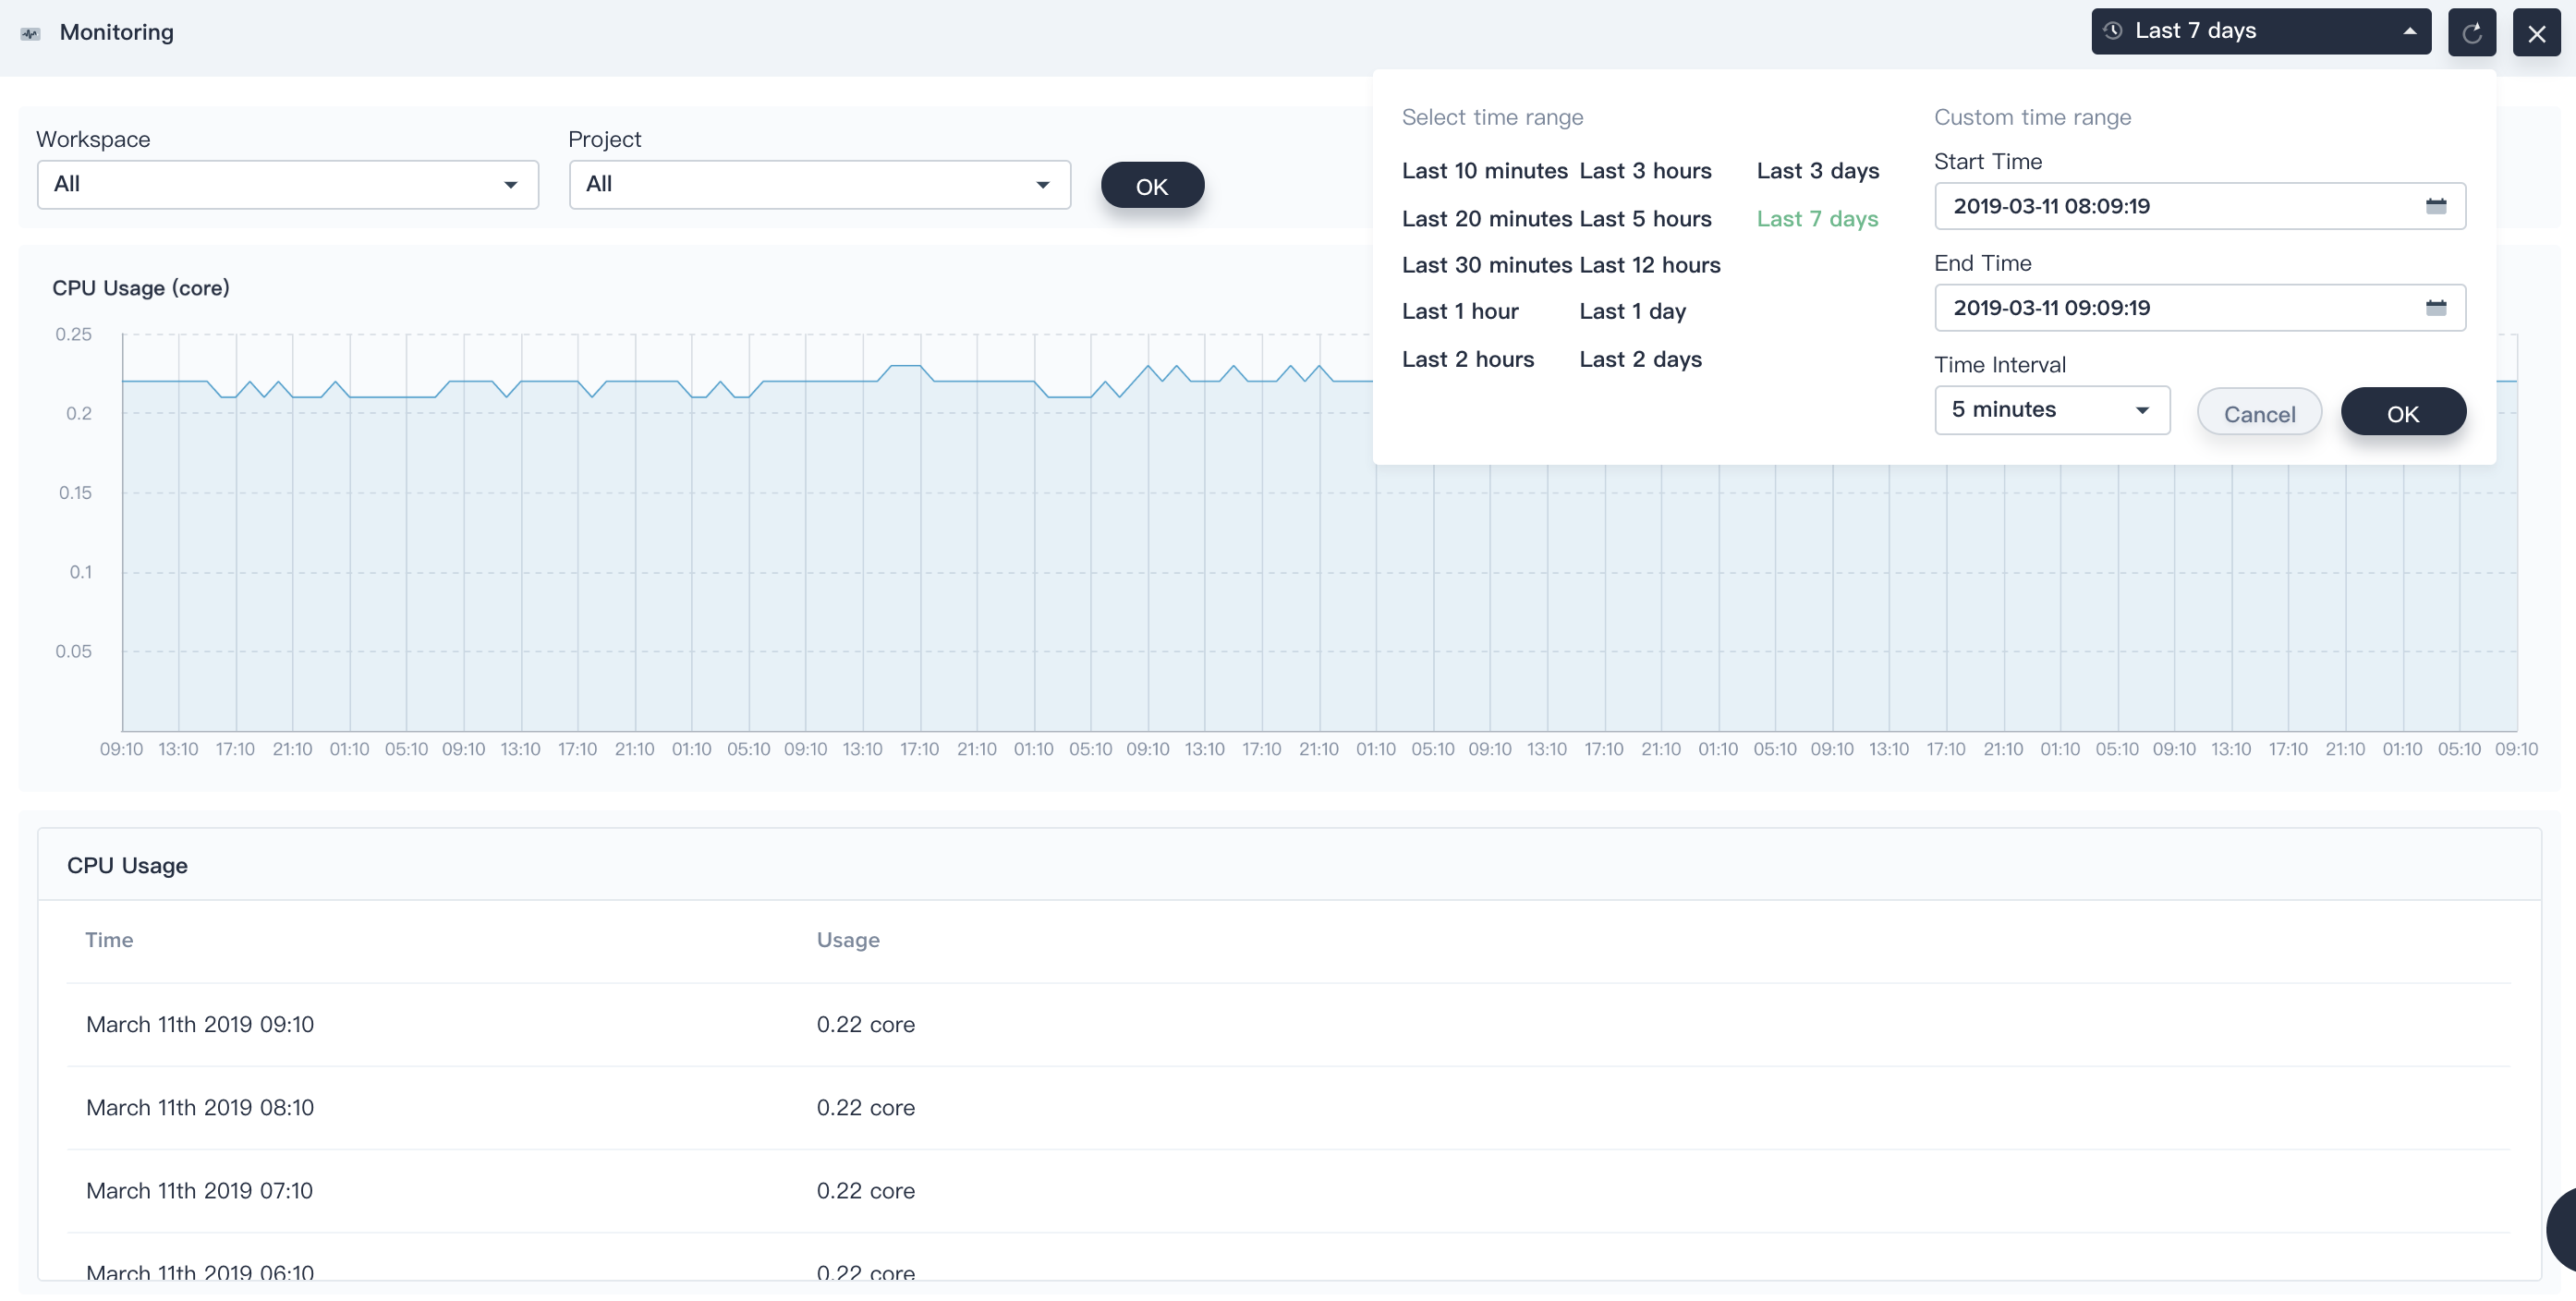
Click on a specific resource to view the specific usage and trends of the cluster at a certain time, such as clicking on CPU usage to enter its details page. The details page allows you to view specific monitoring data by workspace and project, and users can customize the time range as well.
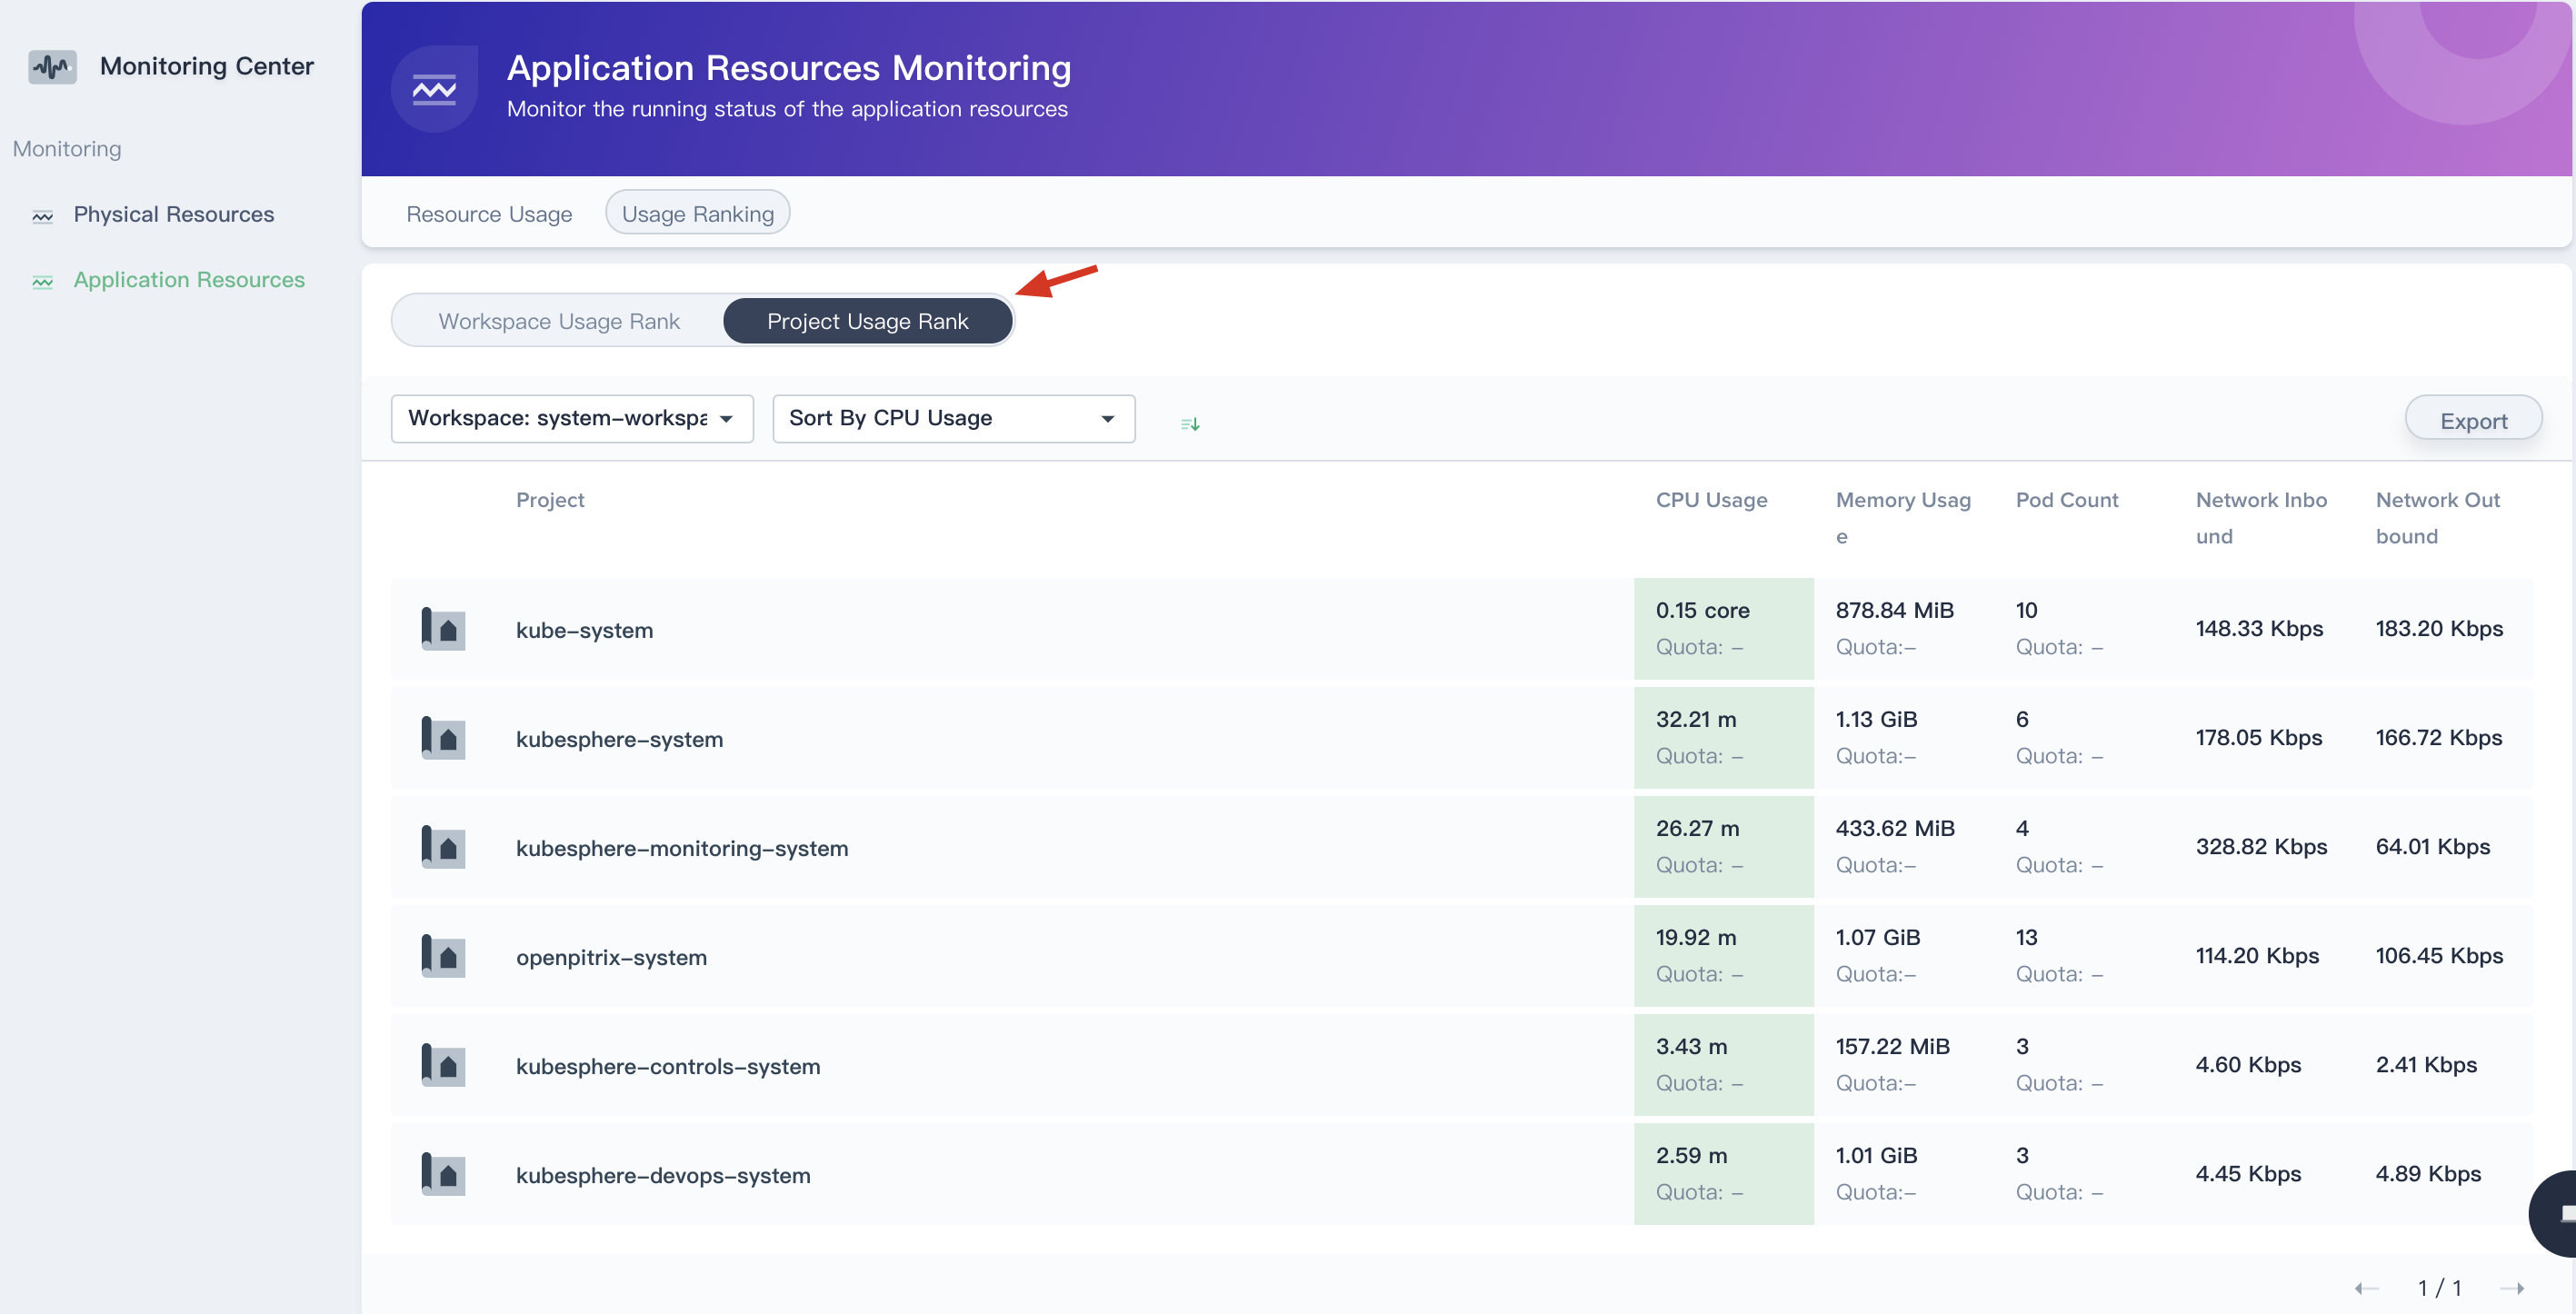
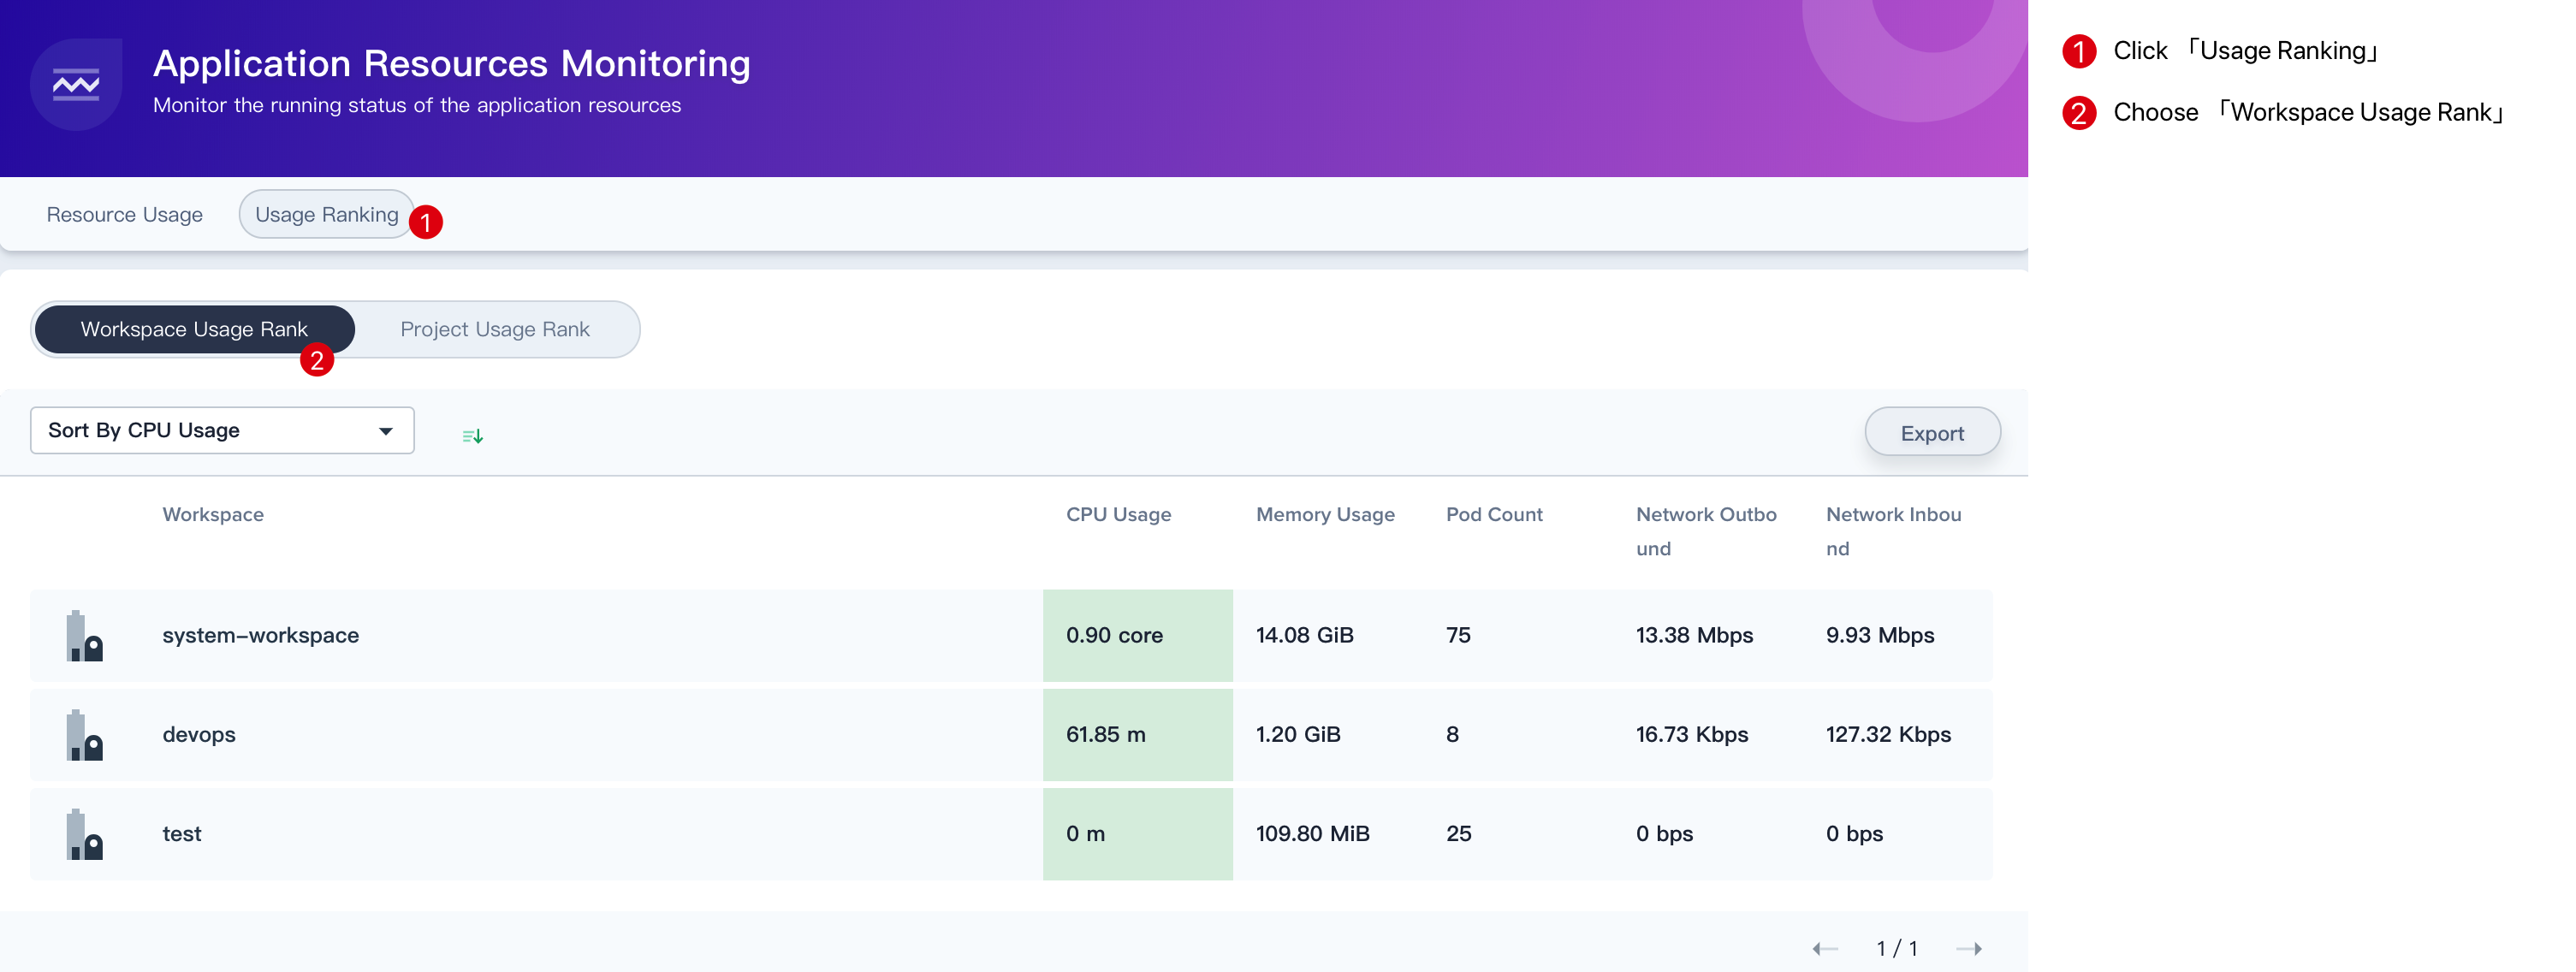
CPU usage

Usage Ranking

Workspace Usage Ranking

The usage ranking supports the ranking of enterprise space resource usage and project resource usage, so that platform administrators can understand the resource usage of each enterprise space in the current cluster, including CPU usage, memory usage, Pod count, network inbound and outbound, support ascending or descending order according to any one of the indicators.

Workspace Usage Ranking

Project Usage Ranking

There can be multiple project in a workspace. The quota, resource usage, and network speed between different projects can be seen at a glance through this part of the ranking result. The five monitoring indicators mentioned in workspace above are also supported. After compares the current resource usage data with the quota, the cluster admin can adjust the quota according to the monitoring situation.

Project Usage Ranking